
We’ve all been there, staring at the Facebook Ads dashboard with twenty colorful charts, wondering what they actually mean. At ShortVids, we’ve probably done that more times than we’d like to admit. But once we learned the secret to proper Facebook Ads data analysis, everything changed, no more “gut feelings,” just sharp, strategic decisions that actually boosted performance. Understanding Facebook Ads Metrics helps you build stronger campaigns, reduce ad costs, and create content that genuinely connects with your audience.
Basically, every number inside your Facebook Ads Analytics tells a story, but most marketers skip reading it. Average CTR across industries is 0.9% to 1.1%, underlining that many campaigns don’t optimise clicks, meaning many advertisers are still flying somewhat blind. Once you stop guessing, the results get predictable, and that’s where ShortVids works its magic to help creators focus on storytelling while the numbers guide the strategy.
Quick Summary
TL;DR: Reading Facebook Ads data transforms guesswork into predictable results. Key metrics like CTR, CPC, CPM, conversion rate, frequency, relevance, and ROI reveal how your audience engages, how much campaigns cost, and if they convert. Proper analysis guides creative decisions, optimizes spend, and boosts performance. ShortVids helps creators turn these insights into scroll-stopping videos that drive consistent leads. #tldr
- Core Components: CTR → CPC → CPM → Conversion Rate → Frequency → Relevance → ROI
- Outcome: Smarter campaigns, lower wasted spend, higher engagement, improved conversions, and predictable growth for Facebook Ads campaigns.
Importance of Analyzing Facebook Ads Data
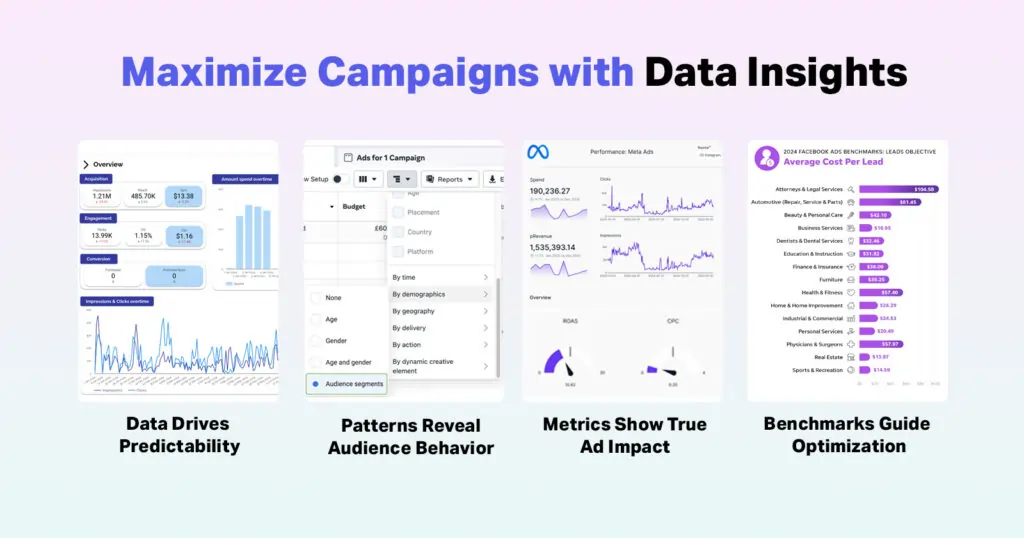
When ShortVids began diving into Facebook Ads data analysis, our campaigns transformed from random experiments to predictable, result-driven systems. Every impression, click, and conversion builds a pattern that defines your ad’s life cycle. Data in online marketing isn’t just decoration; it’s the only honest friend that tells you what’s working and what’s not.
Behind every great ad is solid Facebook Ads reporting, where CTR, CPC, and CPM reveal much more than just spending patterns. Across Industries, the median click-through-rate (CTR) on Meta (Facebook/Instagram) ads in March 2023 was ≈ 1.49%. This shows the baseline of how often people click when they see an ad, i.e., “every impression … builds a pattern.”
These numbers tell you exactly how your audience reacts to creative tone, timing, and targeting. Ignoring them means wasting budget and missing growth.
How to Analyze Facebook Ads Data Like a Pro
Reading numbers may feel intimidating at first, but you don’t need a data degree to understand Facebook Ads analytics, just the right mindset and structure. At ShortVids, we break data into layers so it becomes practical, relatable, and easy to act on.
| Metric | Why It Measures | Insight |
|---|---|---|
| CTR (Click‑Through Rate) | Shows how many people click your ad after seeing it, revealing audience engagement and creative effectiveness. | Helps identify if visuals and messages truly grab attention. |
| CPC (Cost Per Click) | Measures how much you pay per click, reflecting ad spend efficiency and targeting quality. | Indicates whether your campaigns attract the right audience affordably. |
| CPM (Cost Per 1,000 Impressions) | Tracks the cost to reach every 1,000 users, representing overall reach and visibility. | Useful for understanding budget allocation and delivery performance. |
| Conversion Rate | Measures how many clicks result in a desired action, like a purchase or signup. | Reveals how effectively your ad converts curiosity into results. |
| Frequency | Monitors how often an individual sees your ad, important for avoiding ad fatigue. | Keeps campaigns fresh and maintains engagement without overexposure. |
| Relevance Score | Indicates how well your ad matches your audience’s interests according to Meta’s algorithm. | Demonstrates the alignment between targeting, creative, and user intent. |
| ROI (Return on Investment) | Shows total revenue generated per dollar spent on ads. | Defines overall profitability and guides scaling strategies. |
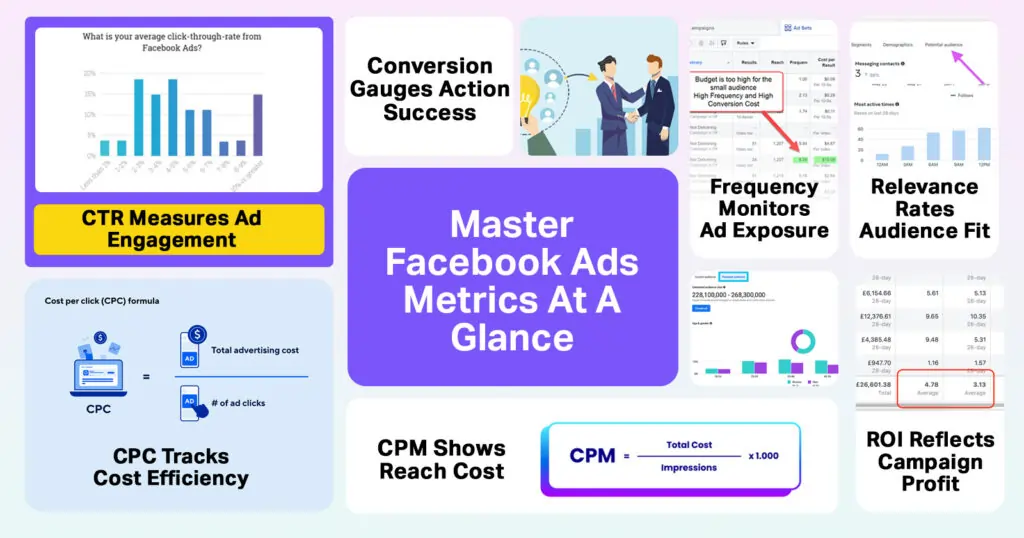
CTR
Understanding CTR is like knowing whether people even notice your ad or scroll right past it. Facebook Ads CTR, CPC, and CPM help you see Engagement strength. A low CTR means creatives may be underperforming, while a high one tells you your visuals or copy are connecting instantly.
CPC
CPC represents how much it costs to get one user to click your ad. The Average CPC for Facebook Ads across all industries is approximately $0.77. If CPC seems too high, refine targeting or adjust visuals to boost intent-driven traffic. In proper Facebook Ads data analysis, this number tells something crucial about whether your budget converts curiosity into action.
CPM
CPM measures cost per thousand impressions and connects directly with visibility. Inside any Facebook Ads dashboard guide, CPM explains how to measure reach efficiency, how effectively your ad is seen by your target audience. A smart advertiser watches CPM shifts to judge seasonality, audience overlap, or Creative Fatigue.
Conversion
Conversions show what happens after someone clicks. Clear Facebook Ads reporting reveals if your offer or call-to-action truly works. By blending Storytelling with conversion data, ShortVids helps brands turn casual scrollers into loyal buyers through videos that match the exact intent audiences desire.
Frequency
When understanding Facebook Ads performance, high frequency can signal ad fatigue. Frequency tracks how many times one person sees your Paid Advertisements. Monitoring this keeps Marketing Campaigns fresh. Adjusting visuals or messages keeps audiences engaged without feeling irritated or oversaturated.
Relevance
The relevance score shows if Facebook’s algorithm believes your content fits the audience’s interests. Ads with a Relevance Score of 8–10 are considered highly relevant and can be up to 400% cheaper than those with scores of 1–3. A low score doesn’t mean failure; it means retargeting or segmenting could help boost engagement naturally, without blowing budgets. Smart Facebook Ads analytics uses this as creative feedback.
ROI
ROI ties everything together. Good Facebook Ads data analysis converts impressions into revenue insight. When ROI Climbs, it means every campaign piece, from visuals to timing, clicks perfectly. And that’s when ShortVids excels, turning marketing data into full-scale growth experiences that truly pay off.
Why Reading Facebook Ads Data Properly Boosts Results
Most advertisers think creativity alone drives success, but it’s actually the mix of creativity and data reading that moves campaigns forward. When ShortVids studies Facebook Ads reporting, we do more than track; we also predict future trends. By leveraging each Marketing Metric, ShortVids turns raw numbers into personalized video strategies that not only grab attention but also sustain growth. Data tells what stories to tell next. That’s the secret edge of Facebook Ads data analysis done right.
How ShortVids Made Facebook Ads Work Smarter
For example, Gene Slade, founder of Lead Ninja and a sales coach, trusts ShortVids to manage and edit his Meta ads. With an ad spend between $2,000-$3,000 monthly, we help generate a steady $10,000 to $12,000 revenue, delivering 20 to 30 quality inquiries and solid leads daily. This success shows how precise Facebook Ads analytics and optimized reporting can transform ad spend into consistent leads and growth, proving the power of data-driven creative strategies.
Now let’s see how big brands boost their results by analyzing their Facebook Ads data.
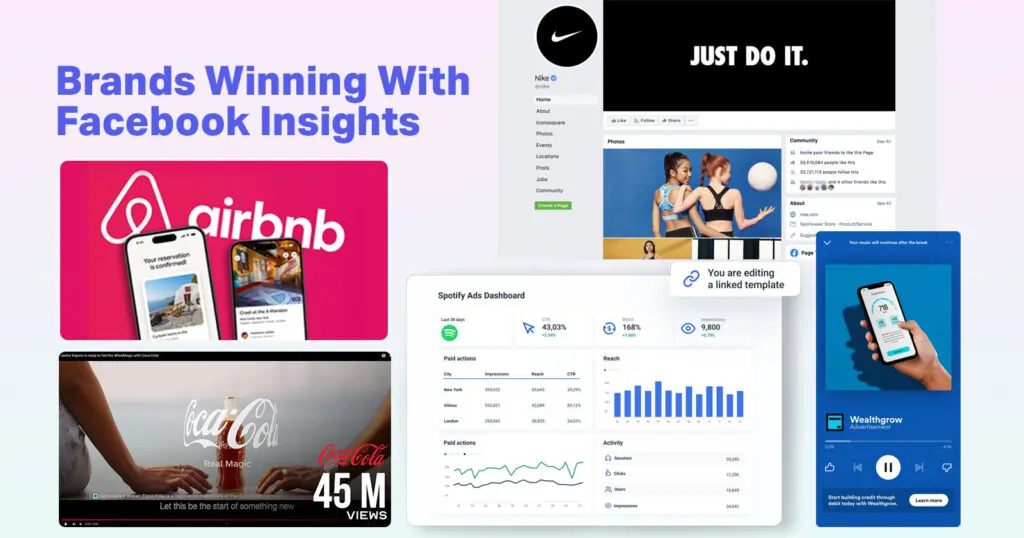
Coca‑Cola’s Facebook Ads Data Analysis Strategy
Coca‑Cola leveraged Facebook Ads data analysis to enhance creative personalization and track performance across regions. Their results showed a 3.1% CTR, a $5.80 CPM, and strong engagement compared with 2025 benchmarks. Using real‑time Facebook Ads reporting, the brand identified audience clusters that responded faster to emotional ads, improving ad recall by nearly 25%.
Nike’s Facebook Ads Metrics Optimization
Nike used Facebook Ads metrics performance tracking to review CTR, CPC trends, and ad frequency insights. Regular use of Facebook Ads analytics tools like Meta Ads Manager allowed Nike to predict performance patterns and scale top creatives faster. Strategic creative testing reduced CPC to $0.78, under the global retail average of $0.82, and pushed campaign CTR to 3.4%.
Airbnb’s Facebook Ads Reporting Excellence
Airbnb applied Facebook Ads reporting and predictive insights to speed up its ad refresh cycle. Their focus on CTR, CPM, and video retention turned impressions into actionable traveler leads at scale. By adjusting frequency from 5.2 to 3.1 and optimizing placements through the Facebook Ads dashboard data, they achieved 4.1% conversions, beating the global median rate.
Spotify’s Facebook Ads Analytics Breakthrough
Real‑time ad insights allowed Spotify to optimize video storytelling and convert engagement into installs 19% faster than in prior quarters. Spotify relied on Facebook Ads analytics to enhance targeting and reduce wasted impressions. Campaigns hit a 2.8% CTR, a $0.66 CPC, and strong engagement within artist campaign promotions.
Final Takeaway!
Every number on your dashboard is a clue about your audience’s behavior and interests. At the end of the day, Facebook Ads data analysis is what separates guesswork from mastery. Once you treat that data as your creative co-pilot, results stop fluctuating. At ShortVids, helping businesses understand Facebook Ads analytics means helping them turn numbers into stories and data into direction. Because campaigns built on insight, not instinct, will surely win more hearts and sales all through 2026 and beyond.
Frequently Asked Questions
Focus on key metrics like CTR, CPC, CPM, conversions, frequency, relevance, and ROI. These show how well your ads engage, how much they cost, and if they convert. Understanding them makes your Facebook Ads data analysis smarter.
Track CTR, CPC, CPM, conversions, frequency, relevance, and ROI for a clear view of performance. These reveal ad engagement, costs, and results to optimize Facebook Ads reporting.
Frequency shows how often people see your ad. Keep it between 1 and 3 to avoid ad fatigue and wasted budget. It’s key to maintaining a strong Facebook Ads performance.
ShortVids turns your Facebook Ads data into winning video strategies. For Lead Ninja, managing $2K–$3K monthly ad spend generates $10K–$12K revenue and 20–30 solid leads daily.
Book a Call Today
- Fixed monthly plans starting at $999
- 24-hour turnaround time (or less) on all short-form edits
- 3-layer quality check system on every video
- No more chasing freelancers or managing editors
- Scale up to 50+ videos/month without hiring in-house
- Content team trained on platform trends, scroll-stopping hooks & storytelling
- Fully managed by professionals – you just upload & approve
- Response time: Under 1 hour (US & GCC time zones)
Cut your production costs, not your standards.