
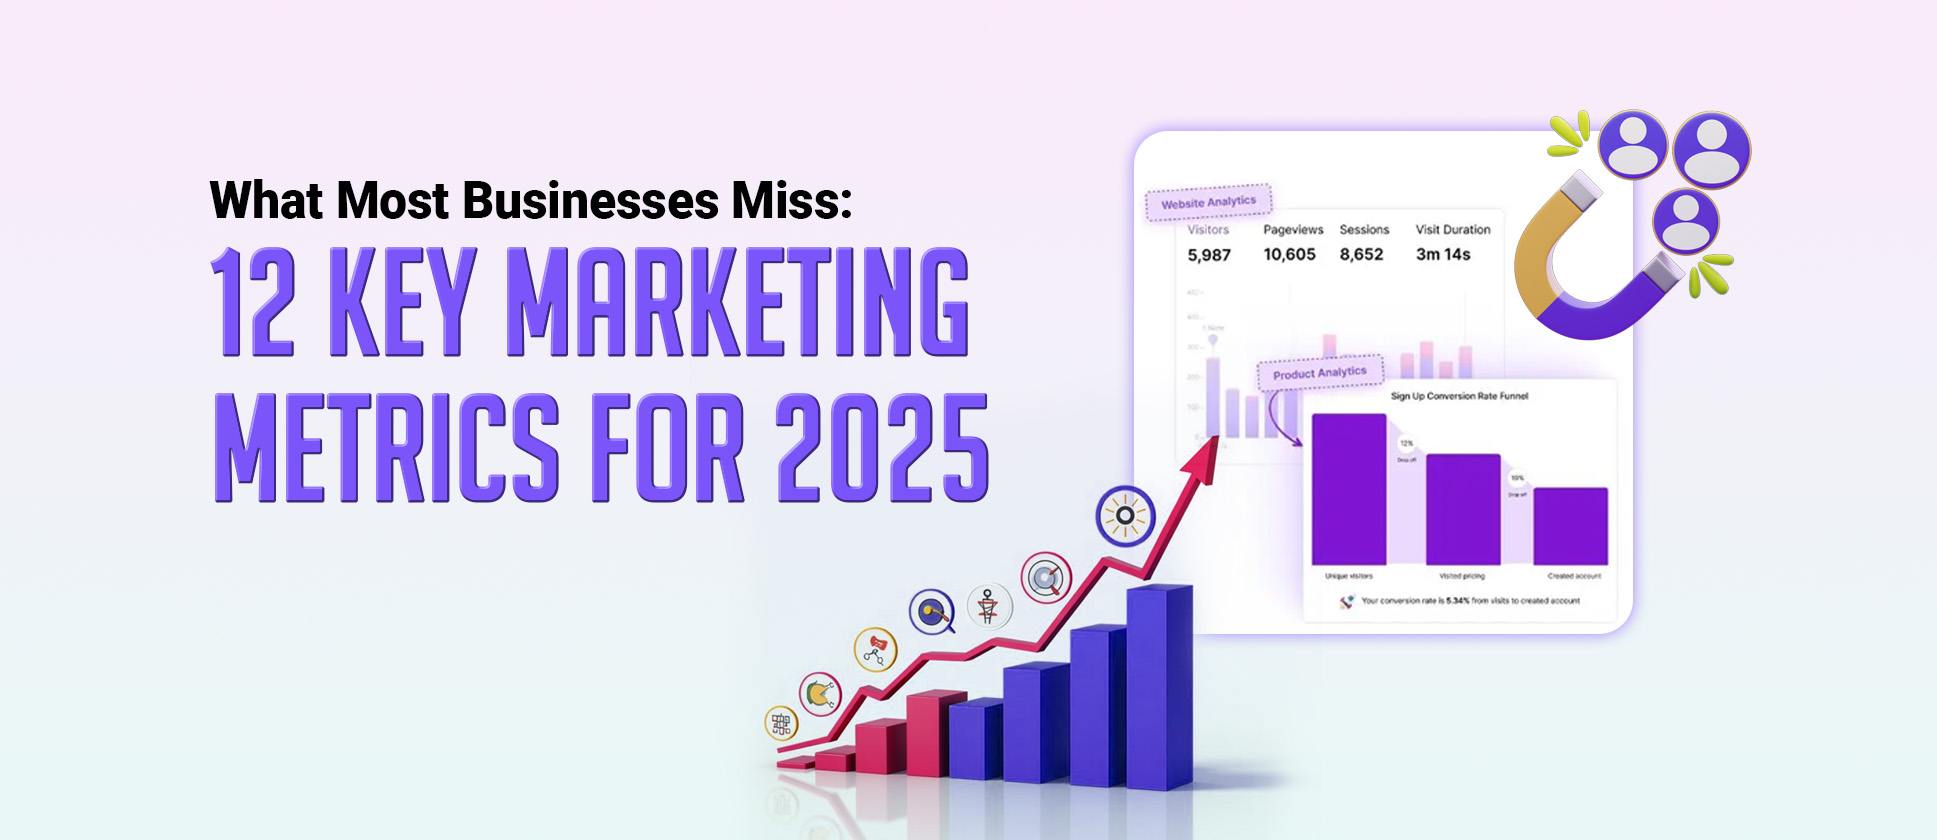
Picture this: you’re running a business in 2025 and suddenly realize you’ve been shooting arrows in complete darkness. Your Marketing Campaigns are running, but you have no clue if they’re actually hitting the target. Sounds terrifying, right? That’s exactly what happens when you ignore tracking Marketing Metrics 2025 demands from modern Businesses. The digital landscape has changed dramatically, and brand awareness metrics, including mentions, sentiment, and branded search rank, as the most valuable in 2025. Yet only 1 in 10 marketers has access to real-time Brand Data. This shocking reality means most businesses are basically flying blind with their marketing investments.
Whether you’re a startup founder struggling to validate your product-market fit or an established business owner looking to optimize your marketing spend, understanding these critical metrics will definitely transform how you approach growth. The truth is that tracking the right metrics isn’t just nice to have anymore – it’s absolutely essential for survival.
With marketing budgets tightening and competition reaching fever-pitch levels, companies need laser-focused insights to make every dollar count. At ShortVids, we’ve witnessed countless businesses improve their entire marketing strategy simply by focusing on the right important business metrics that actually move the needle forward.
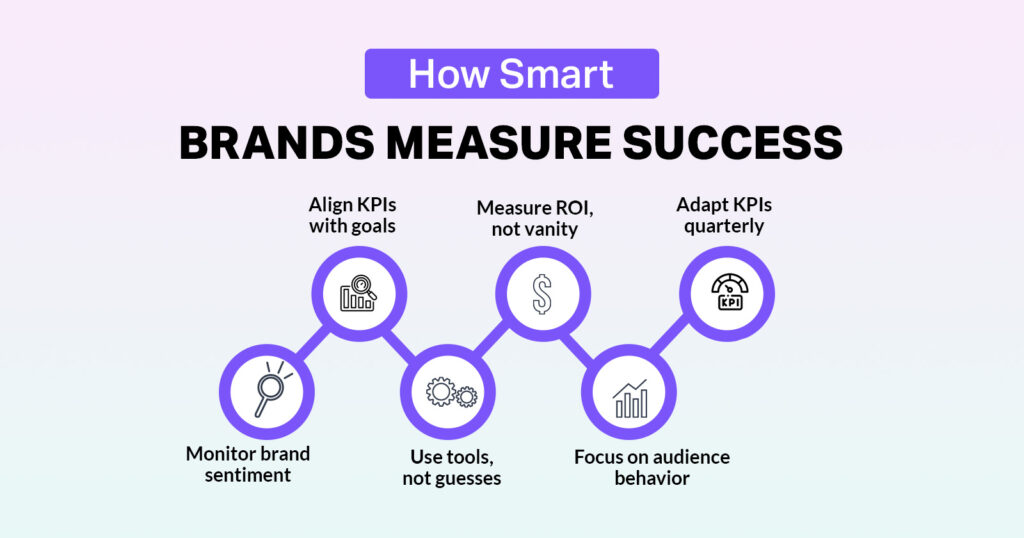
What Makes Tracking Marketing Metrics Crucial for Modern Businesses
The importance of these important business metrics cannot be understated, as they help marketers regularly track and measure success and gauge whether goals are met. Marketing metrics 2025 are performance data that help marketers monitor, record, and measure the progress of marketing plans and campaigns over time.
Think about it this way: would you drive across the country without a GPS or speedometer? Absolutely not. Yet many business owners operate their marketing efforts without proper measurement systems in place.
Why Tracking Metrics Has Become More Critical
The modern marketing landscape has become incredibly complex with multiple channels, touchpoints, and customer journeys. This pressure to demonstrate clear ROI has made tracking key marketing metrics more critical than ever before.
According to the 2025 Sprout Social Index, 65% of marketing leaders say they need to prove how social media metrics support business goals to get leadership buy-in. Without proper metrics, you’re essentially gambling with your marketing budget instead of making informed strategic decisions.
Rise of Digital Marketing
Furthermore, the rise of digital marketing has created both opportunities and challenges. 78% of marketing organizations have adjusted their digital marketing KPIs in recent years. This constant evolution means businesses must stay agile and adapt their measurement approaches. At ShortVids, we help businesses navigate this complexity by focusing on SEO metrics for businesses and metrics that truly matter for their specific goals and industry dynamics.
Which Marketing Metrics Should Every Business Track in 2025
Here are the 12 essential marketing metrics 2025 every business owner must monitor religiously to ensure sustainable growth and profitability.
| Metric | Ideal Benchmark (2025) |
|---|---|
| Customer Acquisition Cost | Should be low enough that CAC leaves room for profit |
| Customer Lifetime Value | At least 3x CAC |
| MQL to SQL Conversion | 13% – 20% (20%+ = strong alignment) |
| Marketing ROI | 5:1 good, 10:1 exceptional, <2:1 unsustainable |
| Website Conversion Rate | 2% (B2C avg), 1–7% (B2B depending on sector) |
| Social Media Engagement | 1% – 5% of followers, 6%+ = excellent |
| Email Open Rate | ~42% avg, 50–55% top performers |
| Email CTR | ~2% avg, 4–5%+ automation flows |
| Cost Per Lead | $30–60 B2B, $10–25 Retail, $100–300+ High-ticket |
| Customer Retention Rate | 85–90% SaaS, 25–40% Retail, 75–85% Finance |
| Multi-Touch Attribution | 70–80%+ conversions traceable to multiple touchpoints |
| Organic Traffic Growth | A steady month-over-month increase is ideal |
Customer Acquisition Cost
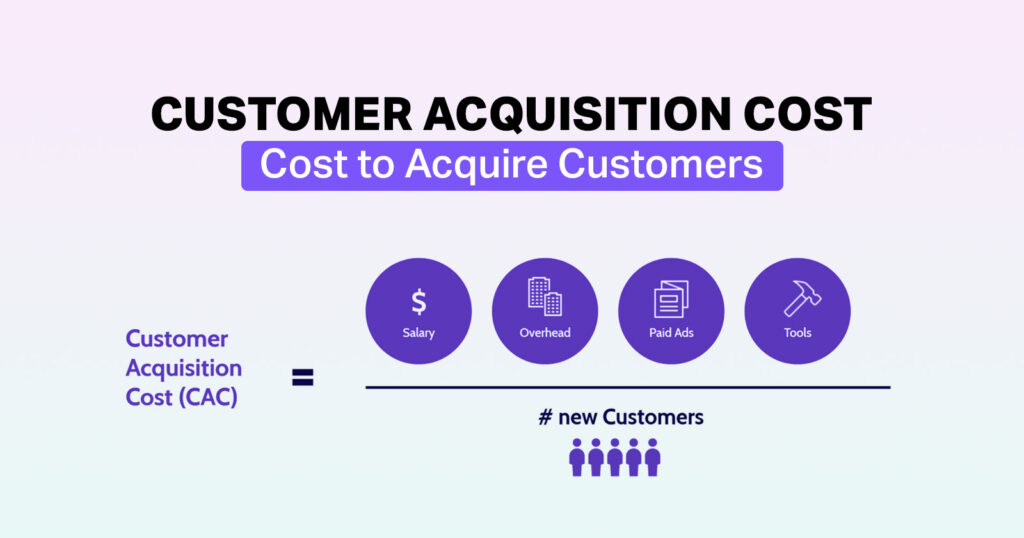
Customer Acquisition Cost (CAC) is the average amount of money a business spends to get one new customer.
Think of it as the price tag on growing your customer base, and trust me, you definitely want to know this number inside and out. These important business metrics basically tell you how much money you’re spending to get each new customer through your doors.
The beauty of tracking CAC lies in its simplicity and immediate actionability. When you calculate your total marketing and sales expenses and divide by the number of new customers acquired, you get a clear picture of efficiency.
At ShortVids, we’ve seen businesses completely change their growth trajectory by obsessively tracking and optimizing their CAC through strategic content creation that reduces acquisition costs while improving lead quality significantly.
Customer Lifetime Value (CLV)
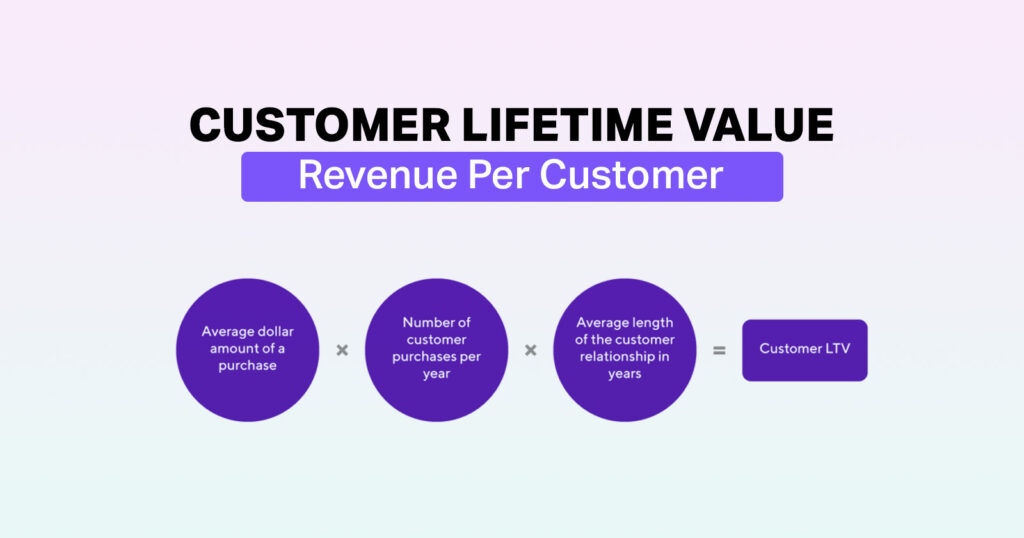
Customer Lifetime Value or CLV represents the total amount of money a customer will probably spend with your business throughout their entire relationship with you.
These key marketing metrics help you understand not just how much customers are worth today but their long-term value potential, which definitely changes how you approach marketing and retention strategies.
At ShortVids, we help businesses optimize both sides of this equation through targeted video content strategies that both reduce acquisition costs and increase customer lifetime value through enhanced engagement.
Understanding CLV allows you to make smarter decisions about how much you can afford to spend on acquiring new customers. If your average customer generates $1,000 over their lifetime, you can confidently invest up to several hundred dollars in acquisition knowing you’ll still maintain healthy profitability.
MQL to SQL Conversion
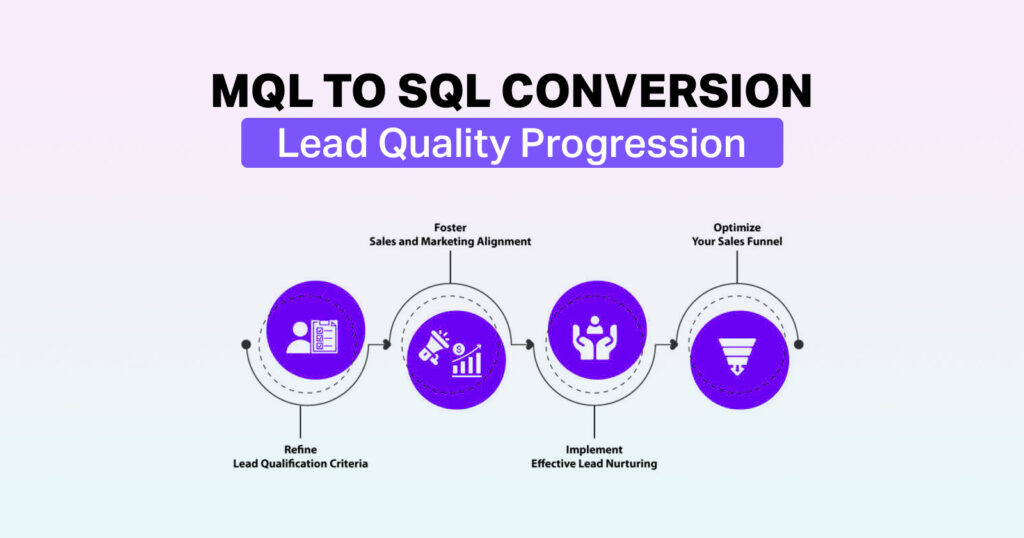
The MQL to SQL ratio measures the efficiency of converting Marketing Qualified Leads into Sales Qualified Leads.
Think of it as the bridge between marketing activity and actual revenue generation. This digital marketing KPIs basically measures how well your marketing team identifies and nurtures leads that your sales team can actually close.
A strong MQL to SQL conversion rate indicates that your marketing team understands your ideal customer profile and creates content that attracts genuinely interested prospects.
The ideal MQL to SQL conversion rate usually falls between 13% to 20%.
- If it’s above 20%, it shows strong alignment between marketing and sales.
- If it’s below 10%, it may indicate poor lead quality or gaps in nurturing.
Marketing ROI
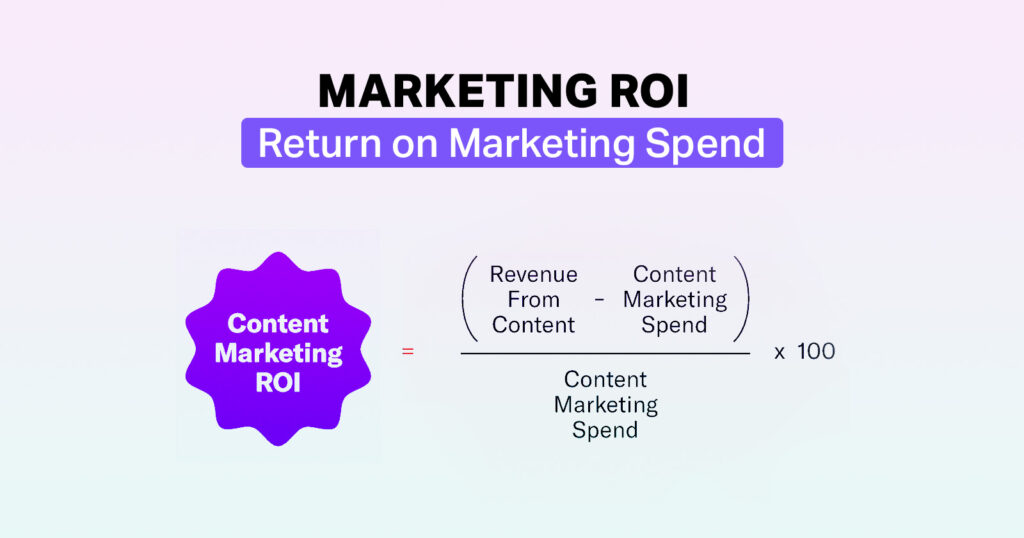
Return on Marketing Investment or ROI, measures the revenue generated for every dollar spent on marketing activities.
ROI is named the top metric by nearly 1 in 5 marketers, but just 34% track it consistently. This metric answers the fundamental question that keeps business owners awake at night: Is our marketing actually making money or just burning through our budget?
Calculating marketing ROI requires tracking both the costs of your marketing efforts and the revenue directly attributed to those activities. This approach helps businesses justify their marketing investments and allocate budgets more effectively. The ideal Marketing ROI should be at least 5:1, meaning for every $1 spent on marketing, the business generates $5 in revenue.
- A 10:1 ratio is considered exceptional.
- Anything below 2:1 is usually not sustainable for long-term growth.
Website Conversion Rate
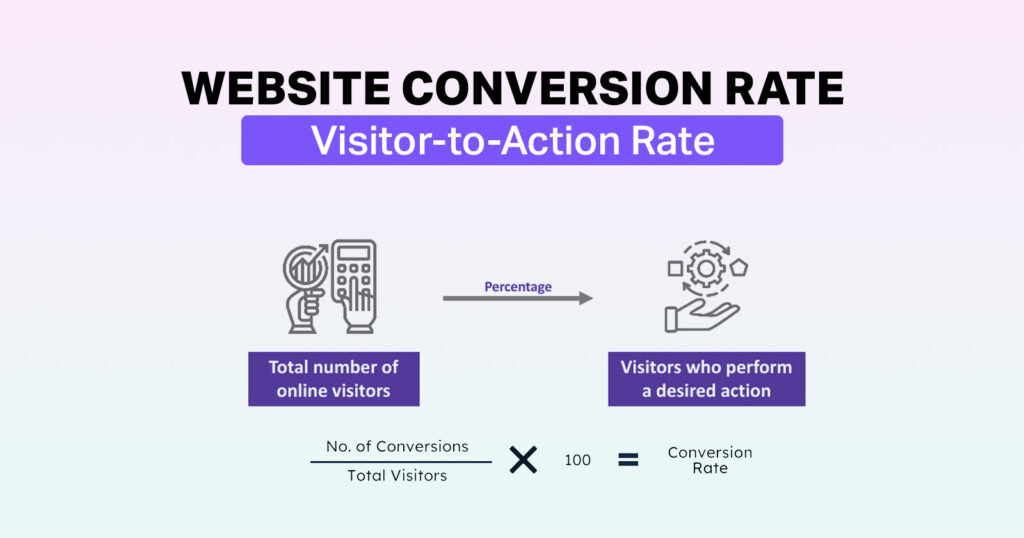
Your website conversion rate essentially measures how effectively your digital presence turns visitors into customers or leads, depending on your business objectives.
This metric measures the percentage of visitors who take a desired action on your website, such as purchasing, subscribing to a newsletter, or downloading an ebook. Understanding conversion rates across different page channels and user segments provides actionable insights for website optimization.
How We Can Help Improve Conversion Rates
At ShortVids, we help businesses achieve improvements through strategic content marketing, metrics optimization, and targeted messaging that resonates with specific audience segments. B2C Ecommerce Businesses averaged a 2% conversion rate across all sectors, while B2B sector conversion rates ranged from 1% for SaaS companies to over 7% for legal services.
Social Media Engagement
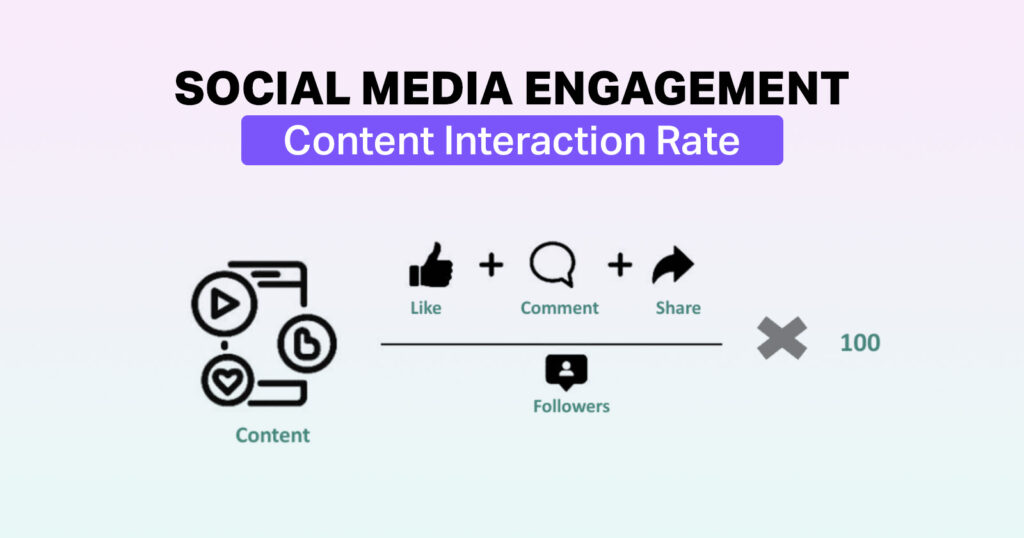
Social media metrics measure how actively your audience interacts with your content across various platforms.
High engagement rates typically correlate with increased brand awareness, customer loyalty, and ultimately revenue growth. These interactions include likes, comments, shares, saves, and direct messages that indicate genuine interest and connection with your business or Personal Brand.
Tracking engagement rates rather than vanity metrics like follower counts provides much more valuable insights into content performance and audience satisfaction.
The ideal social media engagement rate generally falls between 1% to 5% of your total followers.
- 1%–2% is considered average.
- 3%–5% is strong and shows real audience connection.
- Anything above 6% is excellent and indicates highly engaging content.
Email Marketing Performance
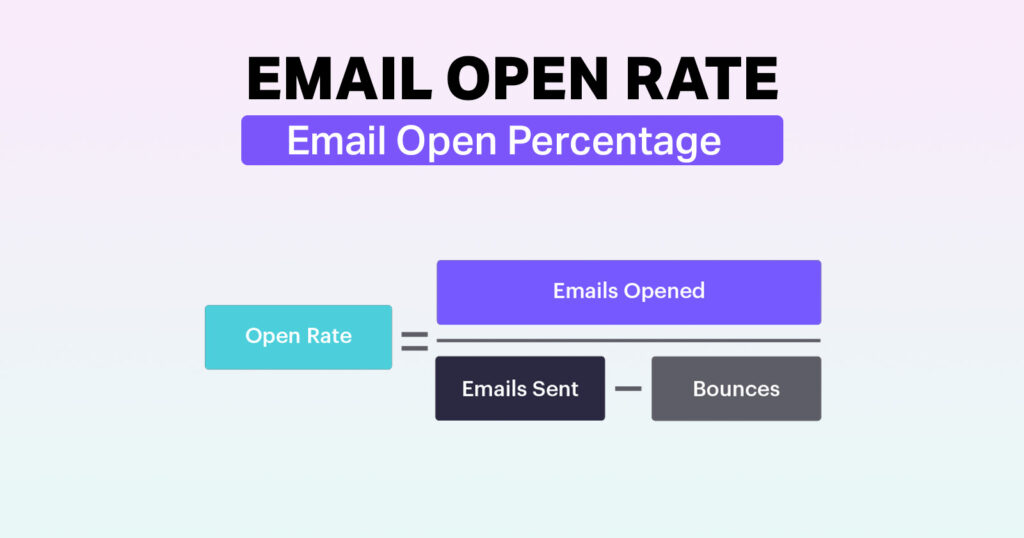
Email marketing metrics provide insights into how effectively you communicate with your subscriber base and nurture relationships over time, including open rates, click-through rates, bounce rates, and conversion rates.
Despite the rise of new marketing channels, email marketing remains a highly effective way to connect and engage with your audience.
The most successful email marketing strategies focus on providing genuine value rather than constant sales pitches. For example, companies like Amazon rely heavily on personalized email campaigns to drive repeat sales and strengthen customer loyalty.
These are some benchmark metrics for Email marketing performance:
- Open Rate: A solid average across all industries, 42.35%, with top performers (like automated flows) hitting 50–55%, and the top 10% reaching 55%+.
- Click-Through Rate (CTR): Around 2.0% campaigns average 1.3%, while automation flows do better, averaging 4–5% or more.
- Click-to-Open Rate (CTOR): About 5.6% overall, with high performers especially in media seeing rates over 10%.
- Bounce Rate: A good goal is below 2%.
- Unsubscribe Rate: The Ideal is under 0.5%, and anything below 0.2% is considered excellent.
Organic Traffic Growth
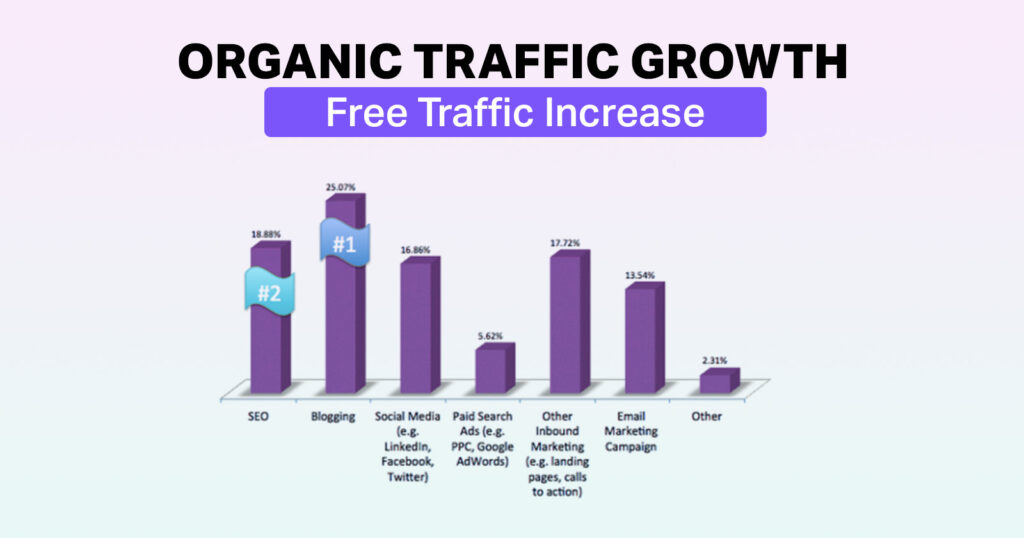
Organic traffic measures how well your SEO metrics for businesses and content marketing metrics strategies work in attracting qualified prospects without ongoing advertising costs.
Organic traffic usually converts better than paid because visitors are already searching for what you offer. That doesn’t make Paid Ads less effective; it simply highlights the strength of intent.
Sustainable Organic traffic comes from consistent, high-quality Content Creation and optimization. At ShortVids, we help businesses strengthen SEO metrics for businesses with video content that ranks in search and spreads on social media, creating long-term growth.
| Aspect | Organic Traffic | Paid Traffic |
|---|---|---|
| Cost | No direct cost per click; driven by SEO metrics for businesses and Content Creation | Requires ongoing ad spend (e.g., Google Ads, Meta Ads) |
| Sustainability | Long-term growth with consistent content marketing metrics | Short-term boost; stops when ads stop |
| Trust Factor | Higher users actively search and trust organic results | Lower often seen as promotional |
| Speed of Results | Slow build-up but compound growth over time | Immediate results once ads run |
| Scalability | Scales with consistent SEO and content investment | Scales with increased budget |
Cost Per Lead (CPL)
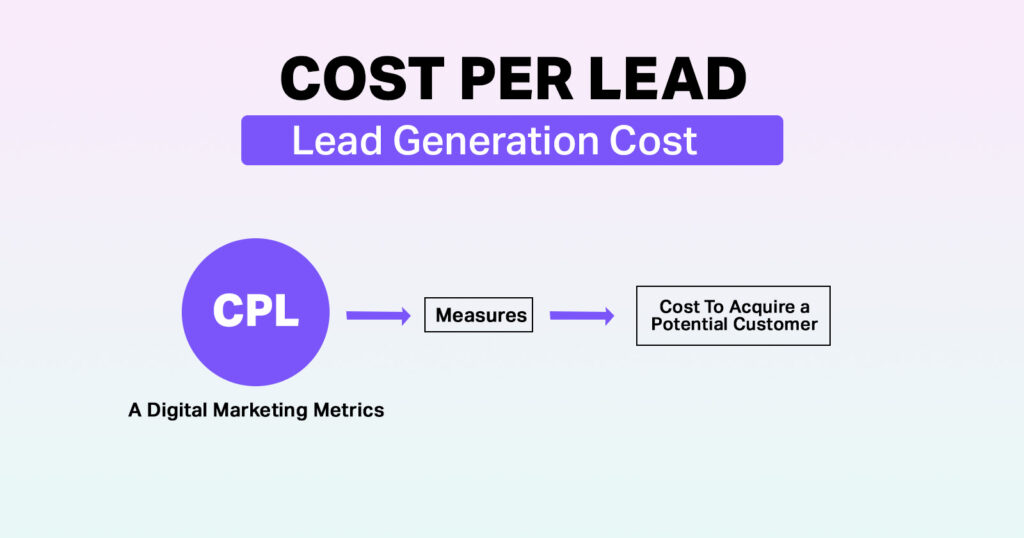
Cost per lead, or CPL, measures the cost of acquiring a lead through paid marketing campaigns on platforms like Meta or Google Ads.
Understanding CPL across different marketing channels helps optimize budget allocation toward the most cost-effective lead generation strategies. For example, if your Meta Ads generate leads at $50 each while your content marketing generates leads at $25 each, you should allocate more resources toward content creation.
The ideal Cost Per Lead (CPL) varies a lot by industry, but here are common benchmarks:
- B2B industries: typically $30 – $60 per lead
- Software/SaaS: around $40 – $100 per lead
- E-commerce & Retail: much lower, often $10 – $25 per lead
- High-ticket industries (finance, legal, healthcare): can range $100 – $300+ per lead, but still be profitable because of higher customer lifetime value.
As a general rule, your CPL should be low enough that your Customer Acquisition Cost (CAC) leaves room for profit.
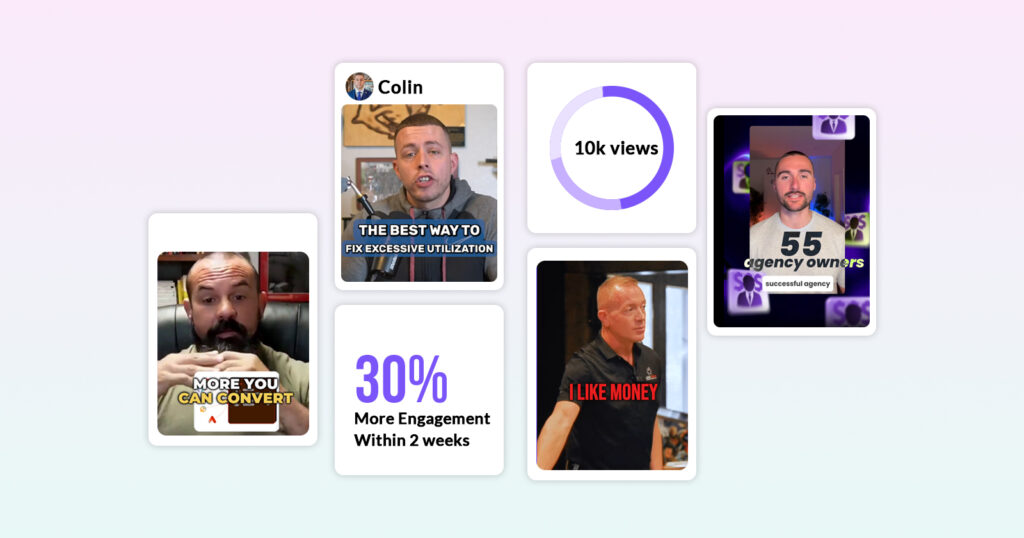
How We Helped Gean Slade
Gene Slade, founder of Lead Ninja and a highly respected sales coach. At ShortVids, the team edits and manages Meta ads for Gene, maintaining his ad spend between $2,000 and $3,000 per month while generating $10,000–$12,000 monthly and producing 20–30 high-quality inquiries and solid leads per day.
By tracking key marketing metrics and optimizing digital marketing KPIs such as CPL, conversion rates, and Social Media Engagement, Gene’s shift to ShortVids’ video-centric content strategy led to measurable improvements: more inbound leads, increased brand authority, and a sustained CPL reduction of 40–60% compared to traditional advertising-only tactics.
Brand Awareness Metrics
Brand awareness metrics measure how familiar your target audience is with your organization and represent the first step in the customer buying process.
Strong brand awareness typically correlates with increased trust, higher conversion rates, and premium pricing power in competitive markets. These metrics track how well people recognize, remember, and talk about your brand across various channels and touchpoints.
Key Brand Awareness Metrics
Here are some of the key brand awareness metrics every campaign manager must track to scale business and get healthy results:
| S.No. | Metric | What It Measures |
|---|---|---|
| 1 | Impressions | How often your content/ad is displayed |
| 2 | Reach | Number of unique people who saw your content |
| 3 | Branded Search Volume | How often users search for your brand name |
| 4 | Social Mentions | Number of times your brand is mentioned on social platforms |
| 5 | Share of Voice | Your brand’s visibility vs. competitors across channels |
| 6 | Direct Website Traffic | Users visiting your site by typing the URL directly |
| 7 | Social Media Followers | Growth in your follower base across platforms |
| 8 | Content Shares | Number of times your content is shared |
| 9 | Sentiment Analysis | Public tone of mentions (positive, negative, neutral) |
| 10 | PR Coverage & Backlinks | Press mentions and backlinks from other websites |
| 11 | Brand Recall Surveys | How well people remember your brand unaided |
How ShortVids Can Help You
Brand awareness measurement includes tracking brand mentions, social media reach, search volume for branded terms, and survey-based awareness studies.
At ShortVids, we help businesses build authentic brand awareness through storytelling that resonates emotionally with target audiences and generates organic word-of-mouth marketing, helping you build a stronger Brand Voice.
This approach creates compound effects that reduce marketing metrics 2025 acquisition costs while building sustainable competitive advantages over time.
Customer Retention Rate (CRR)
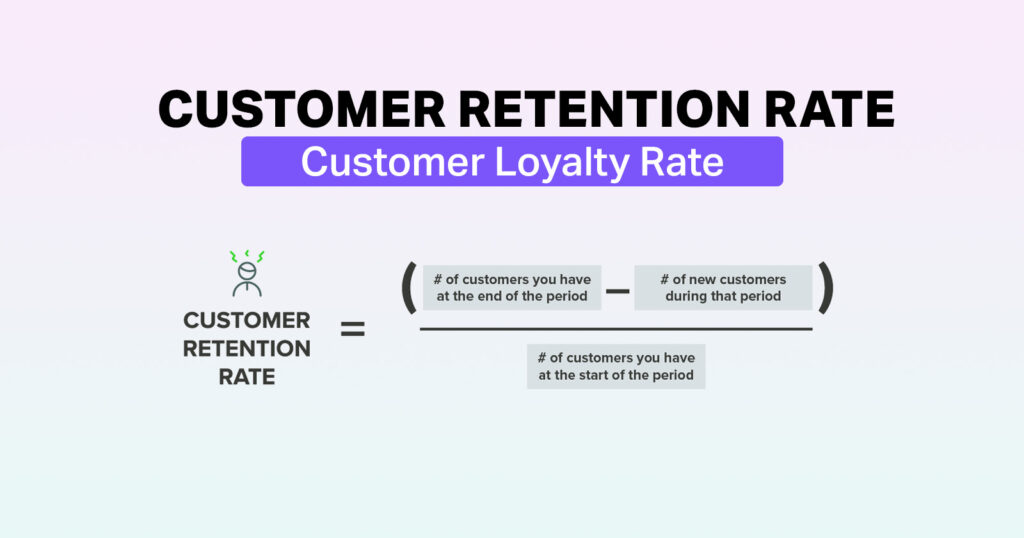
Customer retention rate or CRR, measures your ability to keep existing customers engaged and satisfied over extended periods.
High retention rates indicate strong product-market fit, excellent customer service, and effective ongoing engagement strategies that keep customers coming back consistently. This metric directly impacts profitability because retaining existing customers costs significantly less than acquiring new ones.
Content marketing metrics play a crucial role in retention by keeping customers engaged, educated, and satisfied with their purchase decisions.
The ideal Customer Retention Rate (CRR) depends on the industry, but here are solid benchmarks:
- SaaS & subscription businesses: 85% – 90%+
- E-commerce & retail: 25% – 40%
- Financial services & telecom: 75% – 85%
In general, a retention rate above 80% is considered strong for most businesses, while anything below 50% often signals issues with product satisfaction or customer experience.
Multi-Touch Attribution Analysis (MTA)
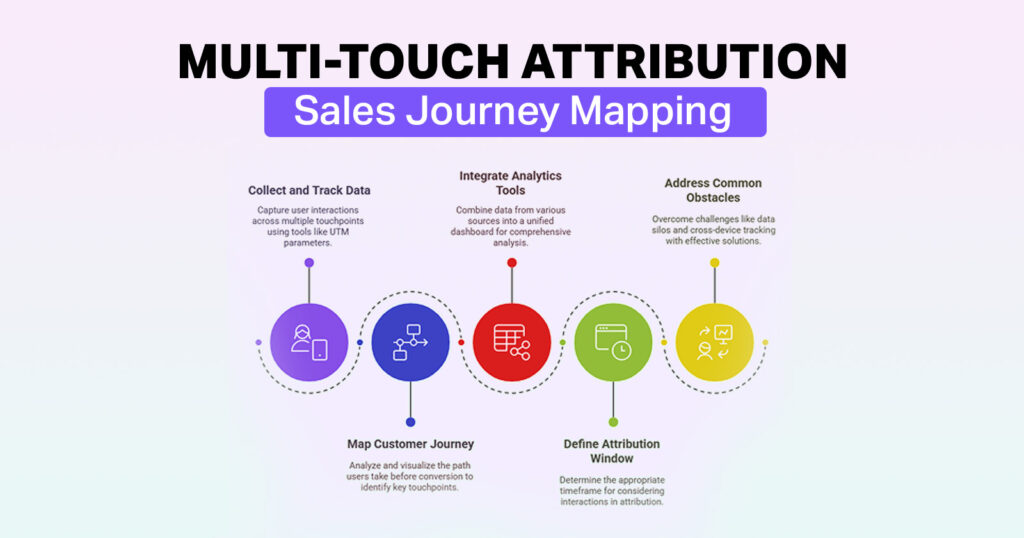
Multi-touch attribution tracks and analyzes all marketing touchpoints that contribute to customer conversions rather than crediting only the first or last interaction.
Modern customers interact with brands across multiple channels before making purchasing decisions, requiring sophisticated tracking methods. This comprehensive approach provides more accurate insights into channel effectiveness and customer journey patterns.
Understanding these complex customer journeys helps optimize marketing spend across channels and create more effective integrated campaigns.
There isn’t a single “ideal number” for Multi-Touch Attribution (MTA) like with CPL or ROI, because it’s a framework rather than a fixed percentage. Instead, the ideal benchmark is about accuracy and efficiency in tracking:
- 70–80%+ of conversions should be traceable to multiple touchpoints (not just first or last click).
- The goal is to see at least 3–5 meaningful touchpoints in a typical customer journey.
- An “ideal” MTA setup reduces wasted ad spend by 20–30% compared to single-touch models.
In simple terms, the ideal metric for MTA is when you can clearly see how different channels (ads, social, email, content, referrals) work together to drive a conversion, and you’re able to invest more in the touchpoints that move customers forward most effectively.
(Learn about the Viral Video Formula for creators)
Conclusion
Understanding and consistently tracking these key marketing metrics will definitely separate successful businesses from those that struggle to justify their marketing spend and optimize their growth strategies effectively. At ShortVids, we help businesses leverage these insights to create video content that drives measurable results and sustainable growth.
Frequently Asked Questions
Tracking marketing metrics 2025 ensures that business owners make informed decisions rather than guessing, allowing for precise adjustments in strategy, budget allocation, and campaign optimization to stay ahead in the rapidly evolving digital landscape.
Startup founders should track customer acquisition cost (CAC), customer lifetime value (CLV), MQL to SQL conversion rates, and website conversion rates to validate product-market fit and guide growth decisions in 2025
In 2025, B2B companies should aim for CPL benchmarks around $30–$60, while SaaS businesses often target $40–$100 per lead, continually optimizing for lower costs without compromising lead quality.
ShortVids creates compelling video content and manages digital ad campaigns that enhance social media engagement and drive down CPL, leveraging personalized storytelling and real-time metric tracking for measurable results.
Book a Call Today
- Fixed monthly plans starting at $999
- 24-hour turnaround time (or less) on all short-form edits
- 3-layer quality check system on every video
- No more chasing freelancers or managing editors
- Scale up to 50+ videos/month without hiring in-house
- Content team trained on platform trends, scroll-stopping hooks & storytelling
- Fully managed by professionals – you just upload & approve
- Response time: Under 1 hour (US & GCC time zones)
Cut your production costs, not your standards.