
Here’s the thing about running Facebook Ads: we’ve all been there. You launch a campaign with high hopes and watch your budget drain faster than your morning coffee disappears. Then you’re left wondering if your results are actually good or if you’re just throwing money into the digital void. That’s exactly where Facebook ad benchmarks come in to save the day. When you know what solid Facebook ads performance metrics look like across different industries and campaign types, you suddenly have the power to judge whether your ads are actually crushing it or just limping along.
These aren’t just random numbers to make you feel bad about your campaigns. They’re basically your compass in the wild world of Social Media Advertising. At ShortVids, we’ve spent countless hours analyzing what makes ads perform like rock stars versus total flops. The reality is that understanding Facebook ad benchmarks isn’t about copying what everyone else does. It’s about knowing where you stand so you can make smarter decisions with your creativity and budget.
Quick Summary
TL;DR: Facebook ad success is metrics-driven. Tracking benchmarks like CTR, CPC, conversion rate, CPM, ROAS, frequency, engagement, and video view rate tells you what’s working and what’s not. Optimizing against these numbers helps you spend smarter, boost results, and avoid ad fatigue. Platforms like ShortVids manage creative, targeting, and budgets to hit these benchmarks consistently. #tldr
- Core Components: CTR → CPC → Conversion Rate → CPM → ROAS → Frequency → Engagement → Video Views → Continuous Testing & Optimization
- Outcome: Higher ad efficiency, lower wasted spend, better audience engagement, measurable ROI, and marketers focused on strategy instead of firefighting underperforming campaigns.
What Are Facebook Ad Benchmarks?
Facebook ad benchmarks are not just random industry averages; they are reference points that help compare your Campaign’s Performance against what’s considered strong in your market. By looking at Facebook ads performance metrics like CTR, CPC, and ROI, you can see whether your ad budget is working as hard as it should. They reflect how well your ads do in terms of attention, engagement, and conversions.
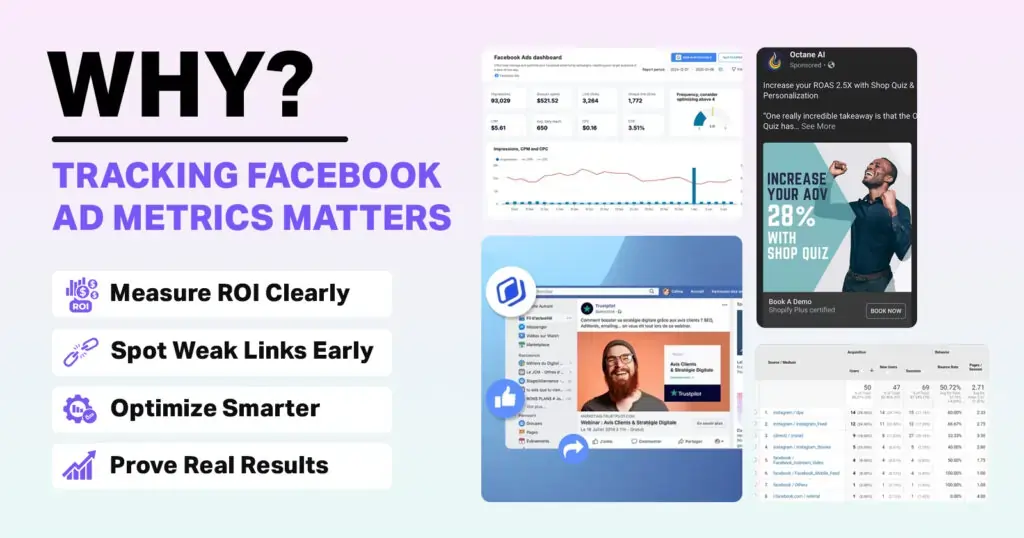
Why Should You Track Facebook Metrics?
For instance, in 2025, the Average CPC in Facebook lead campaigns is $1.92, with a conversion rate of 7.72 % so if your campaigns are paying much above that or converting way below, that’s a signal your targeting, creative, or funnel needs optimization. Tracking Facebook advertising KPIs in 2026 is more than a reporting habit; it’s a way to find growth opportunities before competitors do. Combine these with your Facebook ad ROI benchmarks, and you get a clear roadmap for scaling campaigns with less waste and more impact.
Understanding The Core Metrics Of Facebook Ad Benchmarks That Drive Results
If you’re serious about maximizing your ad results in 2026, focusing on the best Facebook ad metrics to track is crucial. Instead of chasing vanity metrics, these specific numbers tell you what’s actually working so you can tweak ads, adjust budgets, and keep getting better returns every quarter.
Click-Through Rate
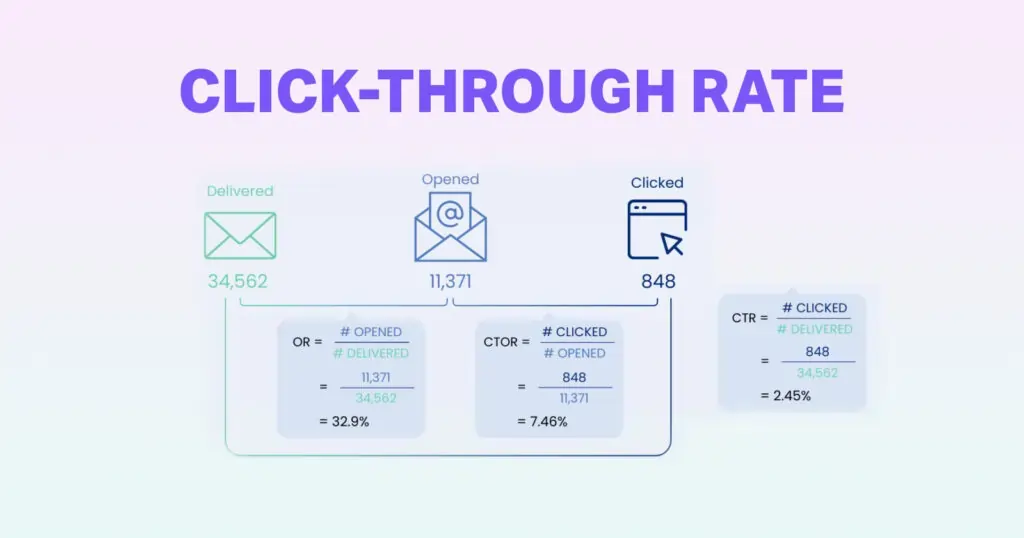
This metric measures how many people actually clicked your ad after seeing it. Most brands use CTR benchmarks to compare different ad sets and refine messaging or visuals. A higher rate probably means the creative is clear and engaging, while a low one shows that the audience isn’t connecting with your content.
Know How You Can Market Your Business Without A Marketing Team
Cost Per Click
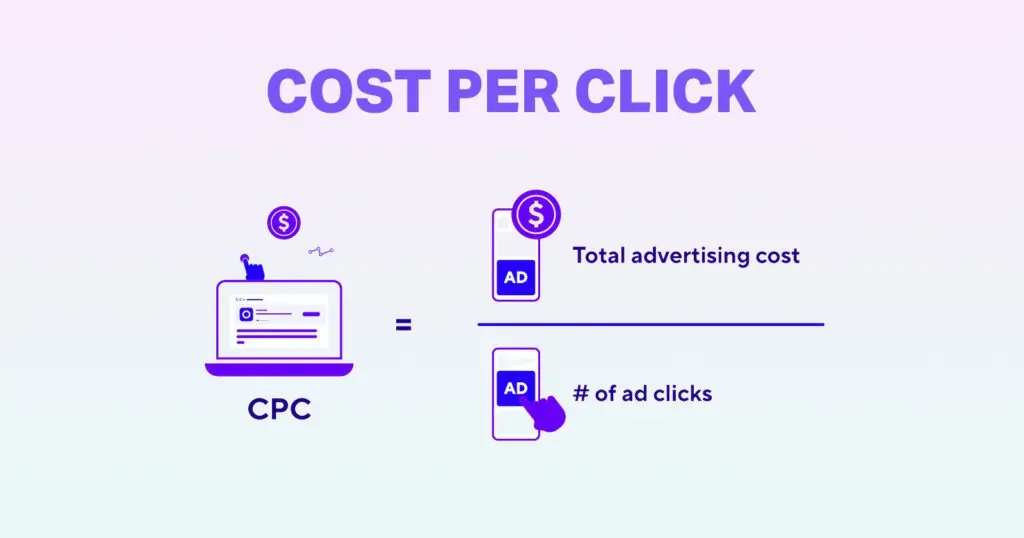
A low Facebook ad CPC benchmark usually means strong targeting and ad relevance, while a high cost likely means your audience definition is too broad. This Marketing Hack is probably the best way to understand if your ad spend is optimized for efficiency. CPC tells you how much you pay each time someone clicks your ad.
Conversion Rate
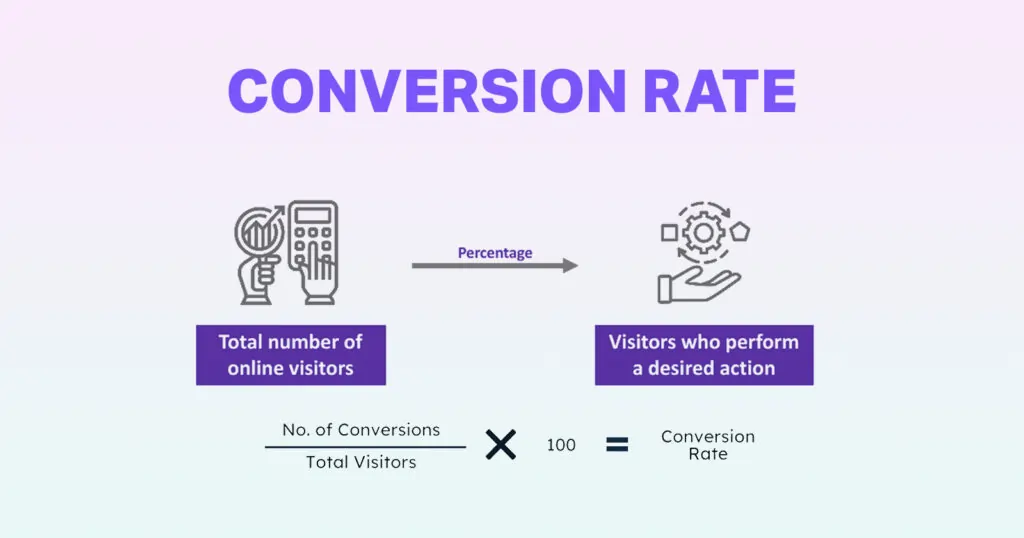
It’s the percentage of users who take the intended action, like signing up or buying after clicking your ad. Tracking conversion performance helps identify which creatives deliver meaningful actions and which campaigns may need better landing pages or CTAs to improve Facebook ads performance metrics.
- The average Facebook ad conversion rate across industries in 2025 is 8.95 %.
- Historically, conversion rates on Meta have hovered around 9.21 %.
- Some industries, like fitness and education, often show conversion rates well above that average (e.g., fitness ~14.29 %).
Cost Per Thousand Impressions
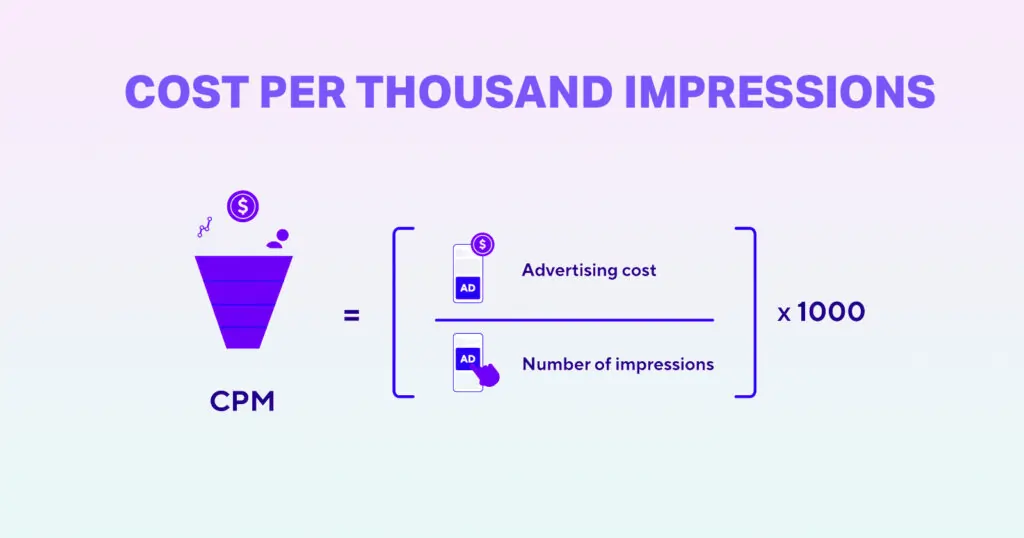
It’s essential for gauging Facebook advertising KPIs, especially brand awareness campaigns. CPM measures how much advertisers spend for every thousand views. Keeping CPM optimized means you reach more people with less spend while maintaining visibility and recall for your business.
- In June 2025, the average CPM on Meta (Facebook + Instagram) is $8.17.
- Earlier data suggest the median CPM across industries is around $5.61 (March 2023 baseline).
- Average CPMs on Facebook have been observed up to $12.74 in specific campaign types or verticals.
A Complete Guide To Instagram Marketing
Return On Ad Spend
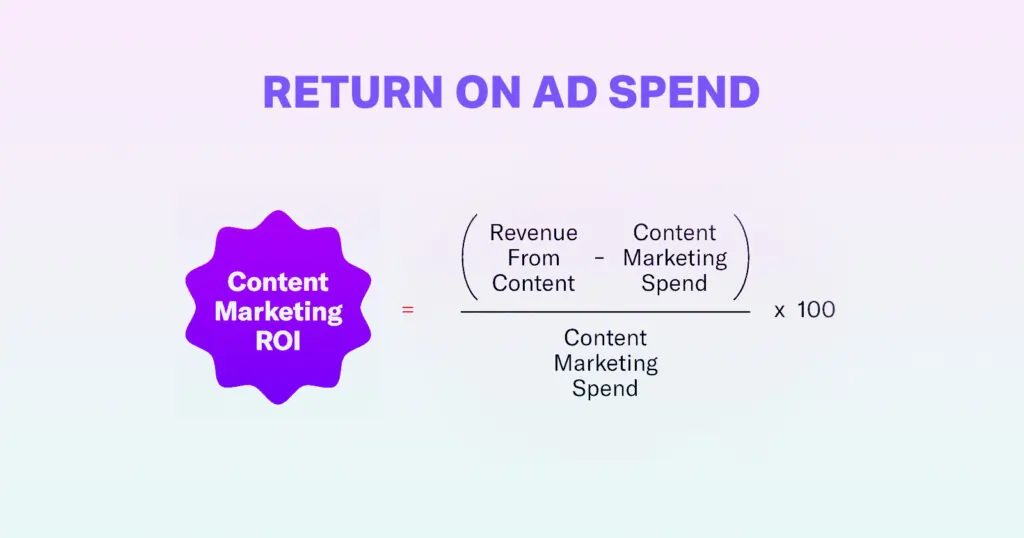
Facebook ad ROI benchmarks directly show how much revenue your campaign generates compared to what you spend. If your ROI is high, it confirms that your Marketing Storytelling and targeting are hitting the mark. If not, it’s a hint that you probably need to refine offers or optimize delivery timing.
- In April 2025, the median ROAS on Facebook ads was 2.19× (i.e. $2.19 revenue per $1 spent).
- Across industries, a broader benchmark puts the average ROAS at 2.98× in mid-2024.
- For retargeting campaigns, ROAS often goes higher. For example, some reports show ~3.61× for retargeting.
Frequency Rate
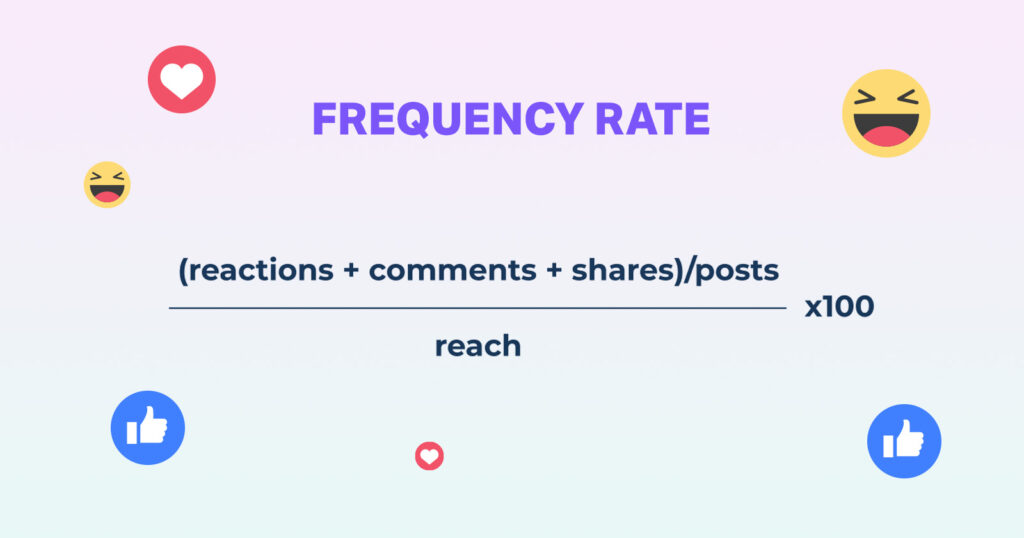
Many Marketing Teams balance this to maintain Engagement without overwhelming the same audience repeatedly across timelines. This shows how often the same person sees your ad. A slightly higher frequency improves brand recall, but going too high might cause ad fatigue. For example, the median Facebook Ad Frequency for B2B Campaigns is 2.51, and for B2C, 2.43, so if your campaigns are showing ads more than 3-4 times per user too quickly, you may be edging into ad fatigue territory.
Engagement Rate
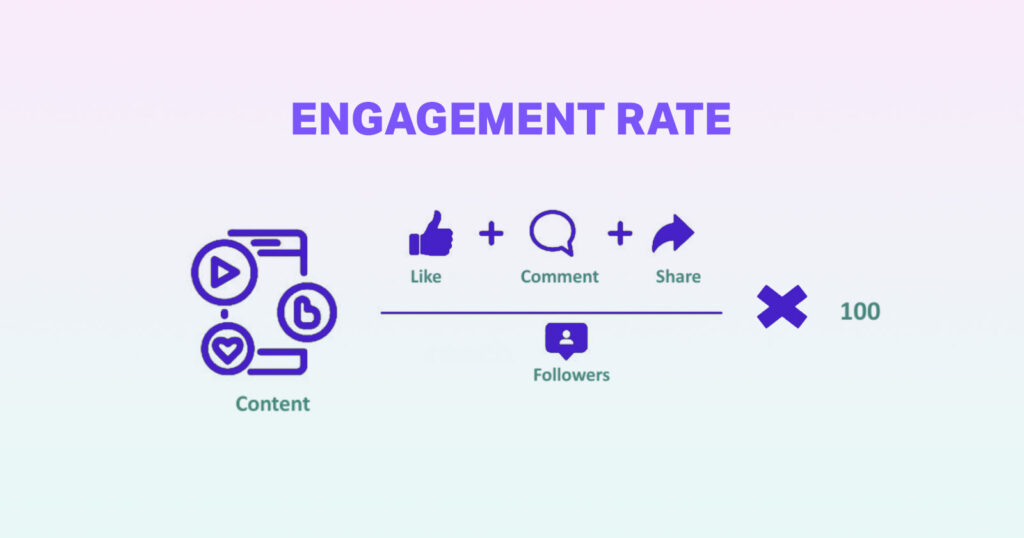
Engagement rate shows how often people interact with your Paid Ads through likes, comments, or shares. Tracking this, along with your Facebook ads performance metrics, helps refine storytelling and encourages more authentic audience participation. It’s one of the best Facebook ad benchmarks because it reflects audience interest rather than vanity exposure. If engagement is high, your creativity and targeting are clearly working well.
- Across industries, average Facebook engagement rates tend to hover around 1.3 % (as of 2025) per Hootsuite data.
- Some deeper benchmarks report a median engagement rate of 0.08 % depending on how you calculate it.
- According to Rival IQ, the median engagement rate across brands is 0.063 %, with top 25 % brands seeing 0.19 %.
Video View Rate
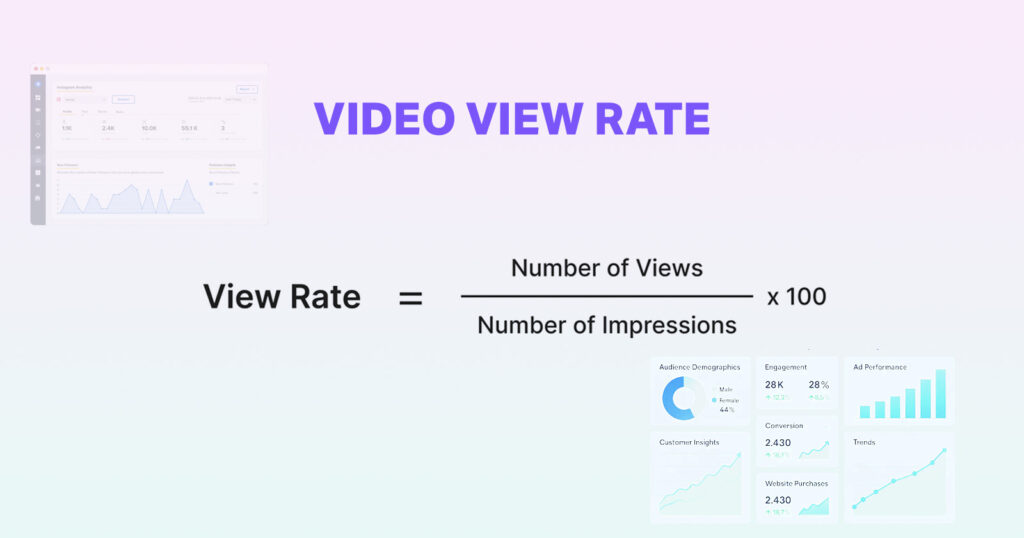
A high rate signals that viewers find your content captivating and watch it for longer durations. Video view rate measures how many users actually watch your video ad compared to total impressions. It’s vital for brands like ShortVids that rely heavily on video storytelling. Combining video data with Facebook ad CTR benchmarks makes it easier to evaluate genuine engagement quality.
- On average, a “reasonable” video view rate benchmark is around 15 % (i.e., ~15 out of 100 impressions become video views).
- In 2025, the average view-through rate for Facebook video ads is about 29%, indicating that nearly 3 in 10 people who see the video start watching it.
- Videos under 15 seconds tend to deliver higher completion rates, with 53.7 % completion compared to 29.4% for longer formats.
Facebook Ad Benchmarks Overview: The Core Metrics That Actually Drive Results
Understanding these key Facebook ad benchmarks gives you a clear picture of how your campaigns are really performing. Instead of guessing what’s working, these numbers show exactly where your ads stand across industries, helping you make smarter creative, targeting, and budgeting decisions.
| Metric | What It Matters | 2025 Benchmarks/ Averages | Ideal/ Good Range |
|---|---|---|---|
| Click-Through Rate (CTR) | % of people who click your ad after seeing it | Avg: 1.57% (video ads) Median (Food & Beverage): 0.96% | 0.90% – 1.60% |
| Cost Per Click (CPC) | Cost paid for each click | Avg (Traffic campaigns): $0.70 Overall Avg: $1.72 Meta Avg (June 2025): $0.68 | Lower = Better targeting & relevance |
| Conversion Rate (CVR) | % of users taking action after clicking (sign-up, purchase) | Avg: 8.95% Meta Historical Avg: 9.21% Fitness Industry: 14.29%+ | 8–15% typical |
| Cost Per Thousand Impressions (CPM) | Cost to reach 1,000 users | Avg (Meta, June 2025): $8.17 Median (2023 baseline): $5.61 High range: $12.74 | $5 – $10 ideal |
| Return On Ad Spend (ROAS) | Revenue earned per $1 spent | Median (Apr 2025): 2.19× Avg (2024): 2.98× Retargeting: ~3.61× | 2× – 4×+ |
| Frequency Rate | Avg # of times each user sees your ad | B2B: 2.51 B2C: 2.43 | 2–3 optimal |
| Engagement Rate | % of people interacting (likes, comments, shares) | Hootsuite Avg: 1.3% Rival IQ Median: 0.063% Top 25% Brands: 0.19% | 0.5% – 2%+ |
| Video View Rate (VVR) | % of impressions that become video views | Reasonable Avg: 15% Avg View-Through: 29% Short videos (≤15s): 53.7% completion | 15–30%+ |
Why Facebook Ad Benchmarks Matter More Than Ever In 2026
At ShortVids, focusing on These Metrics helps create smarter ad storytelling that fits how users actually interact with content. Keeping up with Facebook ad benchmarks in 2026 isn’t just a good idea; it’s the difference between campaigns that survive and ones that thrive. The coolest part is that when you pair those insights with consistent testing and creative adaptation, you end up with campaigns that look natural, feel personal, and convert better.
ShortVids’ Smart Facebook Ad Budget And Performance Control

Working with Gene Slade, founder of Lead Ninja, ShortVids manages and edits his Meta Ads to keep spending between $2000 and $3000 monthly while hitting strong Facebook ad benchmarks. This approach consistently generates $10k to $12k revenue each month with 20 to 30 daily inquiries and qualified leads. By optimizing creative, targeting, and budget flow, we help sustain impressive Facebook ads performance metrics and long-term campaign growth.
How ShortVids Controls Budget And Manages Metrics:
Your Takeaway!
Whether it’s optimizing Facebook ad CTR benchmarks, balancing cost through Facebook ad CPC benchmarks, or maximizing Facebook ad ROI benchmarks, staying data-aware keeps your creative energy sharp. Understanding Facebook ad benchmarks is like learning the secret language of digital performance. Once you know what each number really means, you can confidently shape campaigns that don’t just look good on paper but also hit real goals. So, if you want your ads to do more than occupy timelines, track, compare, and keep improving, always.
Frequently Asked Questions
Facebook ad CTR benchmarks are usually 1% to 2% for most industries, with some sectors higher or lower. Checking your industry average helps set good campaign goals.
Tracking Facebook ads’ performance metrics like CTR shows what grabs attention and brings real interaction, making it easier to improve ads fast.
More impressions and a low CPM benchmark mean better reach for less cost. These numbers help manage your ad’s visibility and spend.
ShortVids keeps Facebook advertising KPIs strong by testing creatives and adjusting tactics, so every dollar gets more leads and a higher ROI.
Book a Call Today
- Fixed monthly plans starting at $999
- 24-hour turnaround time (or less) on all short-form edits
- 3-layer quality check system on every video
- No more chasing freelancers or managing editors
- Scale up to 50+ videos/month without hiring in-house
- Content team trained on platform trends, scroll-stopping hooks & storytelling
- Fully managed by professionals – you just upload & approve
- Response time: Under 1 hour (US & GCC time zones)
Cut your production costs, not your standards.