
Facebook advertising CPM in 2026 is no longer a number you can copy into a spreadsheet and forget about. Costs fluctuate daily, competition shifts hourly, and placements behave differently depending on audience targeting and campaign intent.
While global CPMs generally fall between $5 and $18, recent benchmark data shows a median around $11–$12 per 1,000 impressions across industries. In the United States, where advertiser competition is intense, average CPMs typically range from $18 to $23, with Q4 seasonal spikes pushing costs beyond $28 in highly competitive sectors. (source:Stackmatix)
So instead of asking “What’s the average?”, the smarter question in 2026 is: What should you expect to pay and how do you control it?
This guide breaks down global and U.S. benchmarks, industry-level variations, placement differences, seasonal patterns, and practical optimization strategies. You’ll learn how Facebook advertising CPM is calculated, what drives it up or down, and how to make data-backed Facebook ad budgeting decisions with confidence.
Quick Summary
TL;DR: Facebook advertising CPM in 2026 is driven by industry, audience, objective, seasonality, and creative quality. Brands that utilize engaging short-form video, smart targeting, and optimized placements can reduce CPM, maximize leads, and improve ROI.
#tldr
- Core Components: Audience Targeting → Industry & Objective → Creative Quality → Ad Placement → Seasonal Planning → Testing & Optimization → Short-Form Video Strategy
- Outcome: Lower CPM, higher engagement, better conversions, smarter budget allocation, and scalable Facebook ad campaigns that turn impressions into measurable results.
Want a data-backed estimate suitable for your industry and region?
What Is Facebook Advertising CPM and Why it’s Important for Budget Planning in 2026?
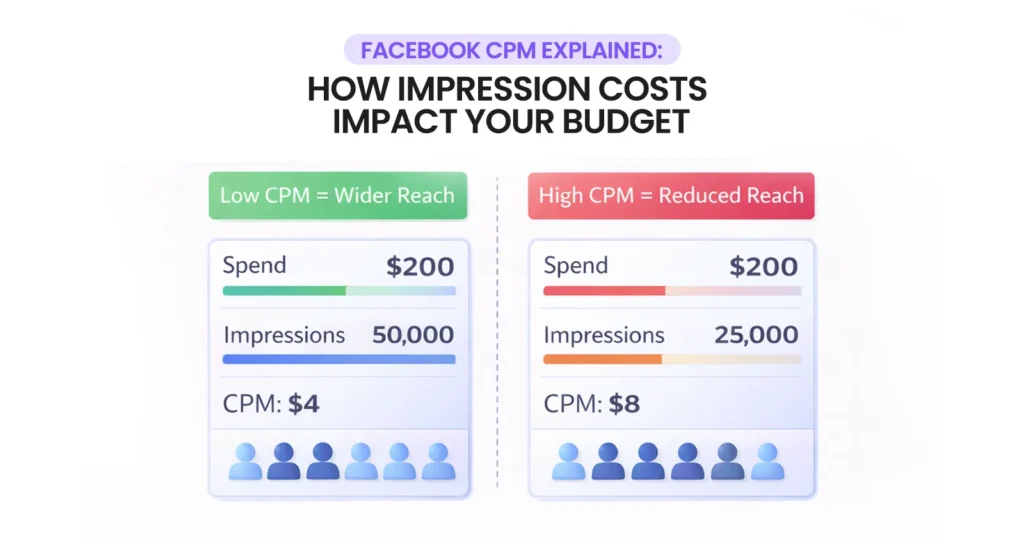
Facebook advertising CPM (Cost Per Mille) is the cost you pay for every 1,000 impressions across Meta platforms, including Facebook, Instagram, Messenger, and Audience Network. Basically, every time your ad shows up in someone’s feed, stories, or reels. It’s not about clicks or conversions; it’s pure visibility by Facebook algorithms. Why obsess over it? High CPMs eat into your budget before anyone even engages, forcing you to either spend more or reach fewer people.
In 2026, understanding CPM is no longer optional. With over 3.98 billion monthly active users across Meta apps (Statista), ad inventory is massive, but competition for premium audiences has intensified. (Source: Statista)
What Does CPM Actually Measure?
CPM measures visibility, not clicks or conversions.
You typically pay CPM when:
- Running brand awareness campaigns
- Optimizing for reach
- Scaling top of funnel ads
- Entering competitive auctions
| Visibility is just the beginning; every impression counts toward engagement, not just clicks.
Why Does Facebook Advertising CPM Matter More in 2026?
Meta operates on a real-time auction system, not fixed pricing. Your CPM depends on multiple weighted signals:
| Factor | Impact on CPM |
|---|---|
| Audience Demand | High competition raises costs |
| Ad Quality Score | Higher engagement lowers CPM |
| Expected Action Rate | Strong performance reduces auction pressure |
| Conversion Probability | Higher intent audiences cost more |
| Seasonality | Q4 can increase CPM by 20–40% |
According to Meta’s ad auction documentation, ads with higher predicted engagement can win auctions at lower effective costs because the system prioritizes user experience.
The better your ad relevance and engagement, the lower your effective CPM even in competitive markets.
What Is the Average Facebook Advertising CPM in 2026 Globally?
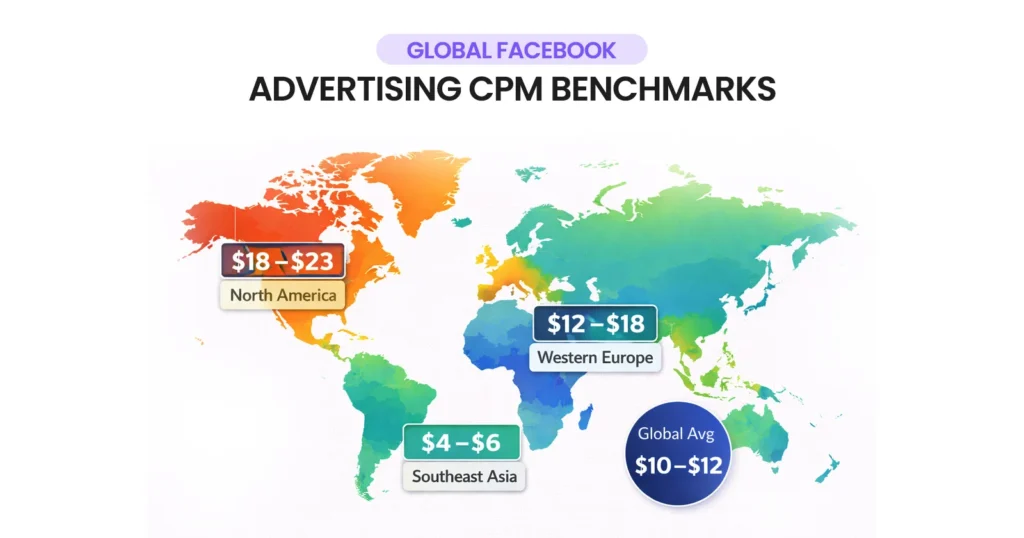
In 2026, the global Facebook advertising CPM (Cost Per Mille, or cost per 1,000 impressions) varies significantly depending on the region, industry, and ad placement. There isn’t a single universal number because Meta’s auction‑based pricing means costs constantly shift based on competition and audience demand.
However, multiple industry sources show a clear range of global averages that most advertisers can expect.
Global CPM Benchmarks for 2026
The table below summarizes typical global CPM figures based on recent benchmark data from ad analytics platforms and industry reports:
| Region Type | Average CPM (per 1,000 impressions) | Typical Use Case |
|---|---|---|
| Global Average | $6 – $15 | Mixed audiences, broad targeting |
| Common Midpoint | $10 – $12 | Standard brand awareness campaigns |
| Lower‑End Reports | $6.50 – $9 | Lower competition markets |
| Competitive Global Campaigns | $12 – $15 | High‑demand verticals or Tier‑1 markets |
Most advertisers targeting mixed international audiences fall within $8–$12 CPM, a healthy baseline for awareness campaigns.
Why Do Global CPMs Vary?
There are several key reasons CPMs differ across markets and campaigns:
- Geographic competition: Ads in high‑demand regions like North America or Western Europe trend higher.
- Audience purchasing power: Higher‑value audiences often command higher bids.
- Industry demand: Competitive sectors like finance or technology push up costs.
- Creative performance: Better creatives can reduce auction costs.
- Ad placement: Some formats deliver cheaper impressions.
For example:
- A broad awareness campaign in Southeast Asia may average $4–$6 CPM.
- A SaaS campaign targeting Western Europe may sit at $12–$18 CPM.
Real–World Example: Placement Differences
To see how ad format influences costs, the table below compares CPM for different placements in 2026. Choosing the right placement can lower your CPM while maintaining reach and engagement.
| Placement | Approx. CPM |
|---|---|
| Facebook Feed | ~$12 |
| Reels & Stories | ~$8.50 – $10 |
Reels and Stories placements are frequently 10–30% cheaper than traditional Feed ads. These formats are still expanding their inventory and attracting slightly lower competition, while offering broader reach and high mobile engagement.
If your objective is reach and awareness, Reels can significantly reduce your Facebook advertising CPM.
Real Case Study: Creative Impact on CPM
According to industry benchmarks, campaign placement and creative format can materially impact impression cost. For example, recent Facebook ads data shows Reels ads often deliver CPMs of roughly $10–$12 compared to Feed placements near $16; a significant cost saving when scaling high‑volume awareness campaigns. (Source: Uproas.io)
This variation underscores the importance of creative ad strategy and placement choices in managing your global Facebook advertising CPM.
Stretch your ad dollars with optimized CPM strategies.
Why Is Facebook Advertising CPM Higher in the United States?
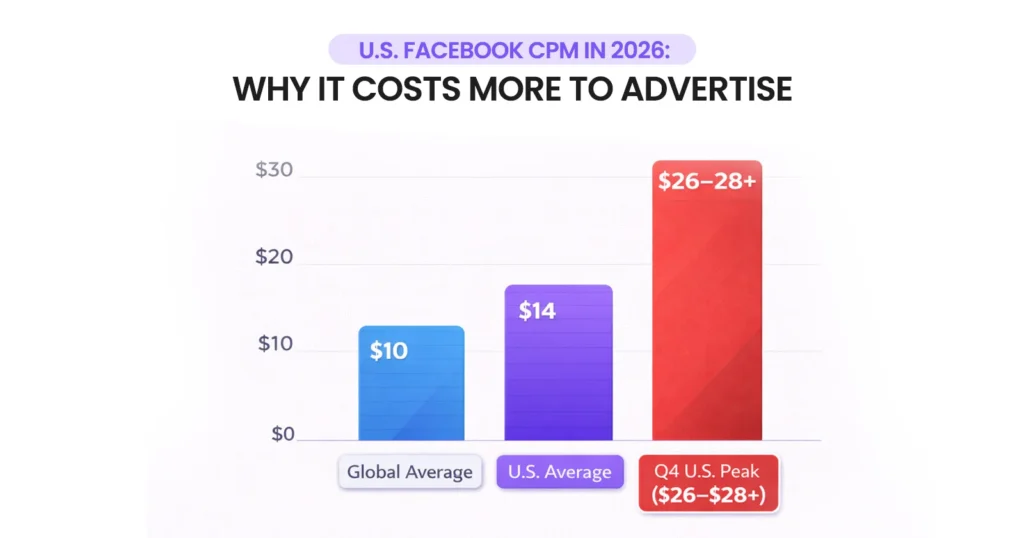
The United States continues to be one of the most expensive advertising markets in 2026 due to its mature digital ecosystem, intense competition, and high-value audiences. Advertisers often find that CPMs here are 10–20% higher than global averages, making budget planning crucial. Seasonal spikes and industry-specific demand further push costs upward, particularly in sectors like e‑commerce, finance, and technology.
According to recent advertising benchmarks, the average global cost per 1,000 impressions (CPM) for Facebook ads in 2026 is approximately $11.62. That too, with a typical range from $5 to $18, depending on targeting, placement, and industry. This highlights just how variable impression costs can be across campaigns and markets. (Source: Nealschaffer)
U.S. CPM Benchmarks
To understand the typical ranges, the table below highlights U.S. CPM benchmarks based on recent industry reports:
| Time Period | Average CPM |
|---|---|
| Overall U.S. Range | $13 – $23 |
| Broader Industry Reports | $18 – $28 |
| Early 2026 Example (January) | ~$22 |
| Seasonal Dip (February) | ~$13–$14 |
The following table shows how CPM fluctuates across different periods and industry data points, helping advertisers plan more accurate budgets.
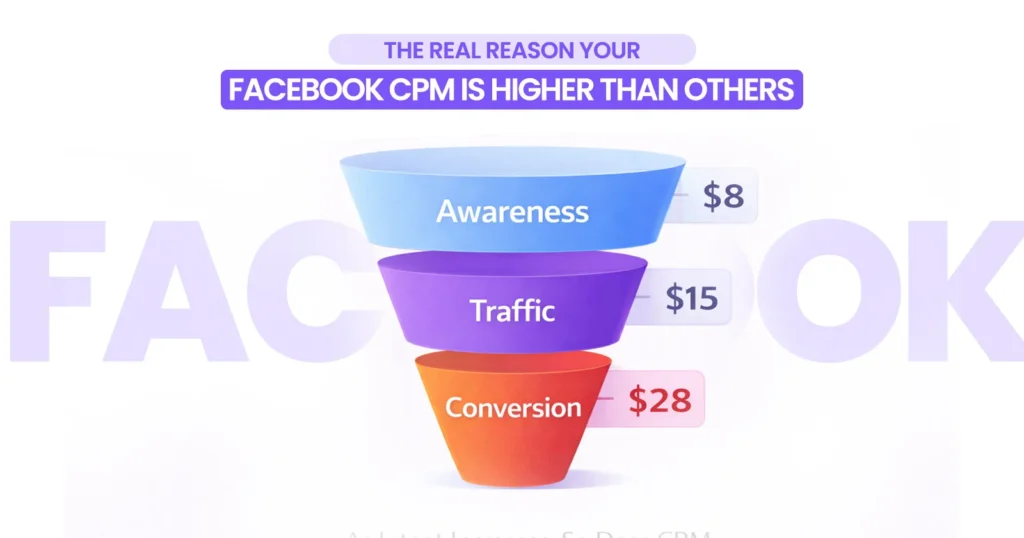
For Example: Consider a DTC beauty brand targeting U.S. women aged 25–45. CPM varies dramatically by season:
- September: $18
- November (Q4 holidays): $26
- January: $14
Even with the same audience, seasonal demand and auction competition can nearly double CPM, showing why quarterly budget planning is essential.
Why U.S. CPMs Are Higher
Before setting your budgets, keep these factors in mind:
- Mature digital ecosystem: More advertisers bidding for the same inventory.
- High competition: Popular industries like tech and retail drive up costs.
- Strong consumer purchasing power: High-value audiences attract higher bids.
- Aggressive Q4 holiday bidding: Black Friday, Cyber Monday, and Christmas campaigns spike CPM by 20–40%.
How Do Industry and Objectives Affect Facebook Advertising CPM?
Facebook advertising CPM in 2026 varies widely depending on the industry and campaign objective. Not all sectors pay the same, and the cost per 1,000 impressions is heavily influenced by audience competition, campaign intent, and customer value. Understanding these differences is critical for planning budgets and maximizing ROI.
Highly competitive industries, where multiple advertisers compete for the same audience, naturally experience higher CPMs. Likewise, campaigns targeting high-value customers or scaling aggressively tend to drive up auction costs.
CPM by Industry (2026 Trends)
The table below highlights typical CPM ranges by industry, illustrating how sector and campaign focus influence advertising costs:
| Industry | Typical CPM Range |
|---|---|
| Industry | Typical CPM Range |
| Finance & Insurance | $18 – $30+ |
| SaaS / Tech | $15 – $25 |
| Legal Services | $20 – $35 |
| E-commerce Retail | $8 – $18 |
| Entertainment | $6 – $12 |
| Consumer Goods | $7 – $14 |
For example, a B2B SaaS company targeting U.S. founders might pay $22 CPM, while a clothing brand targeting a broad interest audience might only see $11 CPM. Even on the same platform and in the same country, the combination of competition, audience intent, and campaign objective can double the cost of impressions.
| Same platform. Same country. Different intent and competition.
How Do Campaign Objectives Change CPM?
Your campaign objective directly impacts how much you pay for impressions on Facebook. Meta’s AI delivery system prioritizes showing video ads to users most likely to complete the desired action, which means higher-value objectives generally increase CPM.
| Campaign Objective | Optimization Focus | Typical CPM Range (2026) |
|---|---|---|
| Awareness | Reach | $6 – $10 (global average) |
| Engagement | Interactions | $8 – $15 |
| Traffic | Clicks / Link Visits | $12 – $20 |
| Conversion | Purchases / Leads | $15 – $30+ |
Since Meta’s AI rewards predicted engagement and the likelihood of conversions, objectives that target high-intent user actions naturally face higher competition and higher CPM. In contrast, awareness-focused campaigns, optimized for broad reach, remain the most cost-efficient option for advertisers. Especially for those who want to maximize visibility while keeping CPM low.
| High-intent objectives like conversions naturally increase CPM but also deliver higher-value results.
What Other Factors Influence Facebook Advertising CPM in 2026?
Beyond location, industry, and campaign objectives, several less obvious factors can significantly affect Facebook advertising CPM in 2026. Advertisers often overlook these variables, yet they can mean the difference between a cost-effective campaign and overspending. So, one needs to understand how targeting creative quality, seasonality, competition, and placement strategy impact CPM to help marketers optimize budgets and maximize ROI.
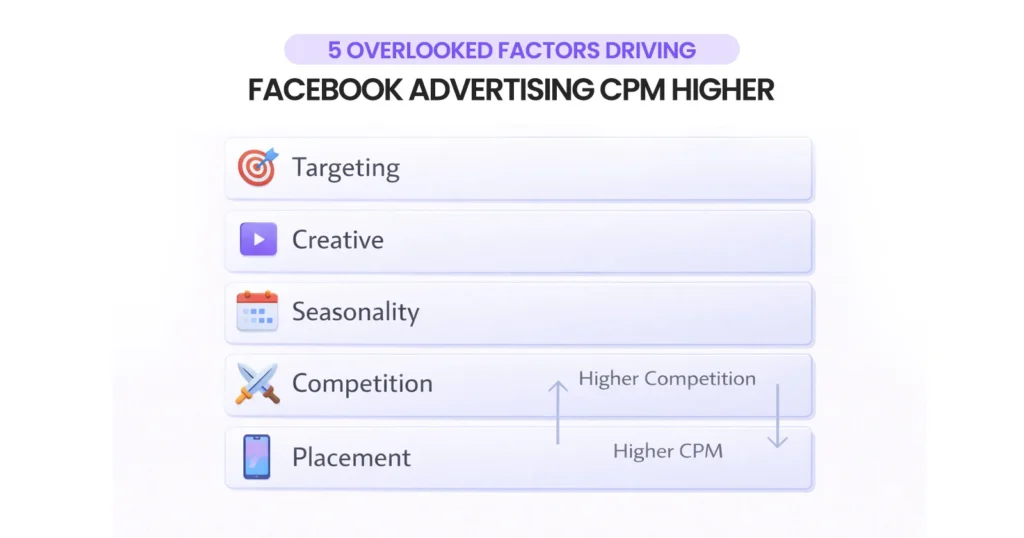
Audience Targeting
The size and specificity of your target audience play a major role in determining CPM. Broad audiences typically reduce competition and lower CPM, while highly specific or niche audiences increase auction pressure. Retargeting audiences may carry higher CPMs, but these often deliver better conversion rates and stronger ROI per impression.
Creative Quality
Ad relevance and engagement directly influence CPM. Ads with strong hooks, clear messaging, native-style formats, and a video-first approach tend to achieve higher engagement while reducing creative fatigue. Higher engagement improves relevance scores, allowing Meta’s auction system to deliver impressions more efficiently, reducing the effective CPM.
Seasonality
Seasonal demand affects auction competition and CPM fluctuations. Q4 holidays generally produce the highest CPMs due to increased competition, while January–February often sees lower costs. Back-to-school and other seasonal campaigns can temporarily spike CPM depending on industry demand.
Competition Density
When multiple advertisers target the same audience simultaneously, auction prices rise. Dense competition drives CPM higher, particularly in competitive industries or Tier-1 markets. Strategically staggering campaigns or exploring untapped audience segments can help manage costs.
Ad Placement Strategy
Placement choice also impacts CPM. Using automatic placements across Facebook, Instagram, and Audience Network generally lowers costs compared to restricting ads solely to the Feed. Optimizing placements ensures broader delivery and cost-efficient impressions, reducing the risk of Facebook ads failure.
How Can You Reduce Facebook Advertising CPM Without Killing Performance?
Lower CPM doesn’t automatically mean better results; cheap impressions that don’t convert are wasted budget. The key is to reduce CPM strategically while maintaining ad performance by focusing on creative optimization, targeting, placements, and testing.
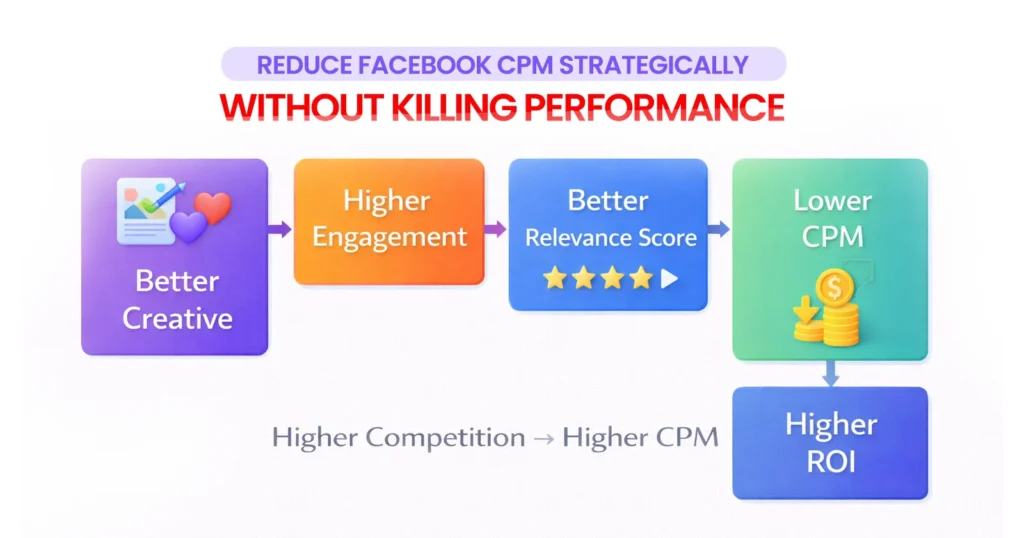
1. Optimize Creative First: High-quality creatives can dramatically lower CPM while boosting engagement. Using short-form vertical videos, refreshing ad visuals every 2–3 weeks, and testing multiple hooks helps capture audience attention and improve relevance scores.
2. Expand Targeting: Broad but relevant audiences often achieve lower CPMs than over-segmented ones. Leveraging Meta’s Advantage+ targeting allows AI to optimize delivery automatically, balancing cost and performance efficiently.
3. Use Reels Strategically: Reels placements can reduce CPM by up to 30% compared to traditional Feed ads. For awareness campaigns, Reels and Stories deliver high reach at lower costs, making them ideal for scaling impressions cost-effectively.
4. Monitor Seasonal Trends: CPMs fluctuate throughout the year, peaking during Q4 holidays. Scaling budgets during historically lower-cost months and pre-testing creatives ahead of busy seasons helps maintain cost-efficiency.
5. Test Small Before Scaling: Running small test campaigns allows you to compare placements, creatives, and objectives before investing heavily. Using historical performance as ad benchmark ensures larger campaigns maintain both low CPM and strong ROI.
How ShortVids Can Help You Lower Facebook Advertising CPM in 2026
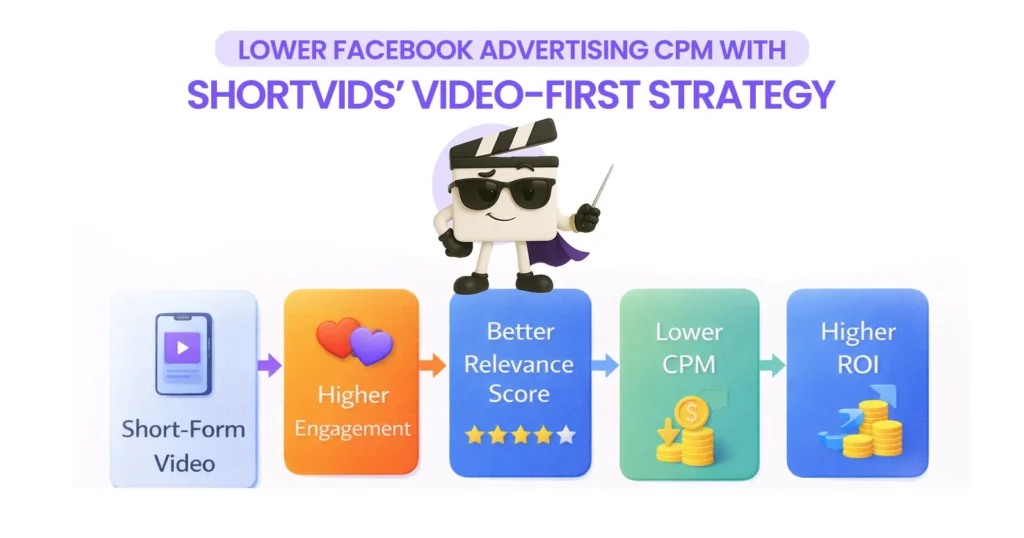
Lowering Facebook advertising CPM is all about creative efficiency and consistent high‑quality content. ShortVids offers a scalable, video‑first content creation model that helps brands produce compelling ad creatives at scale without hiring in‑house teams or freelancers.
Our team offers unlimited short‑form edits, rapid turnaround (24–48 hours), and expert storytelling formats. Thus, helping marketers improve relevance scores, increase engagement, and ultimately drive down effective CPM over time.
Video placements with strong hooks and viewer retention, like the ones ShortVids produces, are proven to reduce CPM by increasing predicted engagement through Meta’s AI delivery system.
| Short-form video campaigns capture attention faster and reduce CPM, turning impressions into revenue.
Case Study Example: ShortVids helped Lead Ninja generate 20–30 quality leads per day using video testimonials and targeted creatives. We do this while maintaining a $2,000–$3,000 monthly ad budget, resulting in $10,000–$12,000 monthly revenue from Facebook ads. It also shows how strong video content can boost results and impact performance metrics tied to CPM and ROI.
Your Takeaway!
Facebook advertising CPM in 2026 averages $10–$12 globally and $18–$23 in the U.S., but your real cost depends on industry, objective, targeting, and season. Focus on creative quality, smart targeting, and placement flexibility rather than chasing the lowest number. Test consistently, monitor trends, and optimize based on performance, not assumptions. Stop overspending on Facebook ads. Partner with ShortVids to craft high-performing video campaigns that lower CPM, boost engagement, and maximize ROI!
Frequently Asked Questions
Aim for $5-10 in low-competition niches, $10-15 globally. Anything under your industry average signals strong optimization.
Divide total spend by impressions, multiply by 1,000. Meta dashboards do this automatically, check weekly.
Yes, videos and carousels often lower it by 15-25% over static images, as they boost engagement.
Likely poor relevance, tight targeting, or peak times. Audit creatives and broaden audiences.
Absolutely, focus on high-engagement content and test placements like Stories for cheaper reach.
Yes. Extremely small audiences often result in increased CPM due to limited auction flexibility.
Yes. Reels can be 10–30% cheaper in many markets, especially for awareness campaigns.
Book a Call Today
- Fixed monthly plans starting at $999
- 24-hour turnaround time (or less) on all short-form edits
- 3-layer quality check system on every video
- No more chasing freelancers or managing editors
- Scale up to 50+ videos/month without hiring in-house
- Content team trained on platform trends, scroll-stopping hooks & storytelling
- Fully managed by professionals – you just upload & approve
- Response time: Under 1 hour (US & GCC time zones)
Cut your production costs, not your standards.