
If you’ve ever opened Meta Ads Manager and felt overwhelmed by columns like CTR, Reach, CPM, CPC, and ROAS, you’re not alone. With over 3.05 billion monthly active users on Facebook as of 2025, according to Statista. More than 10 million active advertisers running campaigns globally, the platform generates massive volumes of performance data daily.
The problem isn’t the data. It’s knowing which Facebook campaign metrics actually matter and how to interpret them correctly to drive profitable decisions.
Most advertisers look at surface numbers like reach or clicks. Smart marketers look deeper. They analyze how CTR impacts CPC, how frequency affects fatigue, how CPM reflects competition, and how conversion rate connects quality content to traffic to revenue. The average Facebook ad CTR across industries ranges between 0.9 percent and 1.7 percent. Yet top-performing campaigns consistently exceed 2 percent, showing that optimization makes a measurable difference. (Source: Wordstream)
This guide will walk you through the most important Facebook campaign metrics step by step, including reach, impressions, CTR, clicks, CPM, CPC, CPA, and ROAS. By the end, you will not only read campaign reports but also understand them, diagnose issues confidently, and make smarter optimization decisions.
Quick Summary
TL;DR: In 2026, Facebook ad success isn’t about clicks alone but about understanding CTR, reach, frequency, CPC, CPA, and ROAS. ShortVids helps brands interpret campaign metrics, optimize creatives, and implement data-driven strategies to boost engagement, conversions, and revenue.
#tldr
- Core Components: Metric Analysis → Creative Testing → Audience Optimization → Conversion Tracking → ROI Focus
- Outcome: Smarter campaigns, higher engagement, profitable ad spends, and measurable growth.
Turn Facebook campaign metrics into actionable results fast!
What Are Facebook Campaign Metrics and Why Are They Necessary for Real Results?
Facebook campaign metrics are the measurable data points inside Meta Ads Manager. They show how your ads perform across Facebook world exposure, engagement, cost efficiency, and revenue impact. These numbers are not just dashboard indicators. They are decision-making tools that determine whether your ad budget is working or leaking.
Even the small inefficiencies in your Facebook campaign metrics can quickly compound into large financial losses. So, one needs to understand what each metric signals to separate strategic marketers from guesswork advertisers.
How Are Facebook Campaign Metrics Structured Inside Meta Ads Manager?
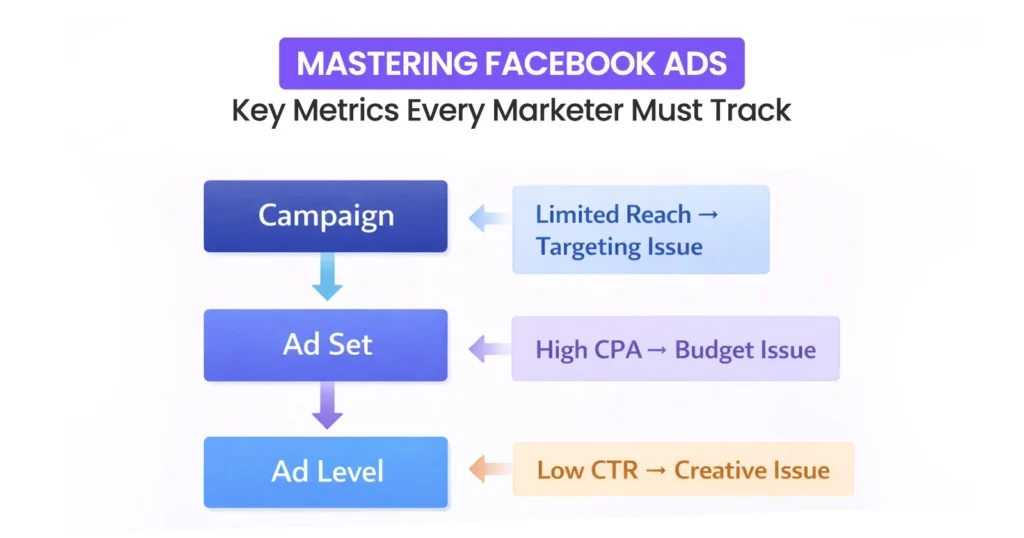
Inside Meta Ads Manager, metrics appear at three levels:
- Campaign level → Overall objective performance
- Ad Set level → Audience targeting and budget allocation
- Ad level → Creative performance and engagement
Each level tells a different story.
For example:
- If CTR is low at the ad level → Creative issue
- If CPM is high at the ad set level → Audience competition issue
- If ROAS is weak at the campaign level → Funnel or offer issue
You can customize columns under the “Columns” dropdown to view performance, delivery, engagement, or conversion-focused metrics depending on your campaign objective.
Why Do So Many Advertisers Misread Campaign Reports?
They focus on isolated numbers instead of understanding how metrics relate to each other. Many marketers struggle not because they lack data but because they can’t interpret it properly. In fact, only 30 % of CMOs feel confident measuring marketing ROI accurately, while 47 % say they struggle with attribution. This shows how challenging it is to translate raw campaign numbers into meaningful insights. (Source: PPC Chief)
The issue isn’t access to data but the actual interpretation.
Consider this real-world example: an e-commerce brand runs a traffic campaign targeting 18 to 35-year-olds. Their report shows:
- 500,000 impressions
- 100,000 reach
This means frequency equals 5. If CTR also drops from 1.8 % to 0.9 % within a week, it signals ad fatigue. Ignoring this early warning could result in rising CPC and declining conversions.
What Types of Facebook Campaign Metrics Should You Monitor First?
To simplify analysis, break Facebook campaign metrics into four primary categories:
| Metric Category | Examples | What It Tells You |
|---|---|---|
| Visibility Metrics | Reach, Impressions, Frequency | How widely your ad is seen |
| Engagement Metrics | CTR, Clicks, Video ad Views | How compelling your ad is |
| Cost Metrics | CPM, CPC, CPA | How efficient your spend is |
| Outcome Metrics | ROAS, Purchases, Leads | Whether your ads generate revenue |
This structure prevents overwhelm and ensures you evaluate campaigns logically rather than emotionally.
Mastering Facebook campaign metrics is not optional in 2026. In a platform where competition increases yearly and CPM costs fluctuate based on demand, reading reports strategically is how advertisers stay profitable while others overspend.
What Are the Most Important Facebook Campaign Metrics to Track?
While reading a campaign report, focus on the four categories that help to understand Facebook campaign metrics easily. Grouping metrics this way allows you to identify issues quickly without getting lost in numbers.
- Visibility metrics
- Engagement metrics
- Cost metrics
- Conversion metrics
In this section, we start with visibility metrics, which lay the foundation for understanding how widely and how often your ads specifically B2B ads are seen.
Get smarter with Facebook campaign metrics via ShortVids!
What Is Reach and Why Does It Matter?
Reach measures the number of unique people who see your ad at least once. Unlike impressions, which count every view (even repeat ones), reach shows your actual audience exposure. High reach with solid engagement usually indicates a well-targeted campaign.
For example, if your campaign shows 50,000 impressions but only 20,000 reach, each person saw your ad 2.5 times on average.
Frequency Explained
Frequency tells you the average number of times each person sees your ad:
Frequency = Impressions ÷ Reach
Now let’s take a closer look at the Frequency Benchmarks 2026 in this table:
| Campaign Type | Ideal Frequency |
|---|---|
| Brand Awareness | 1–3 |
| Traffic Campaign | 2–4 |
| Retargeting | 3–8 |
| Conversion (Warm) | 4–10 |
If frequency exceeds 5–6 in cold audiences, expect:
- Rising CPC
- Lower CTR
- Creative fatigue
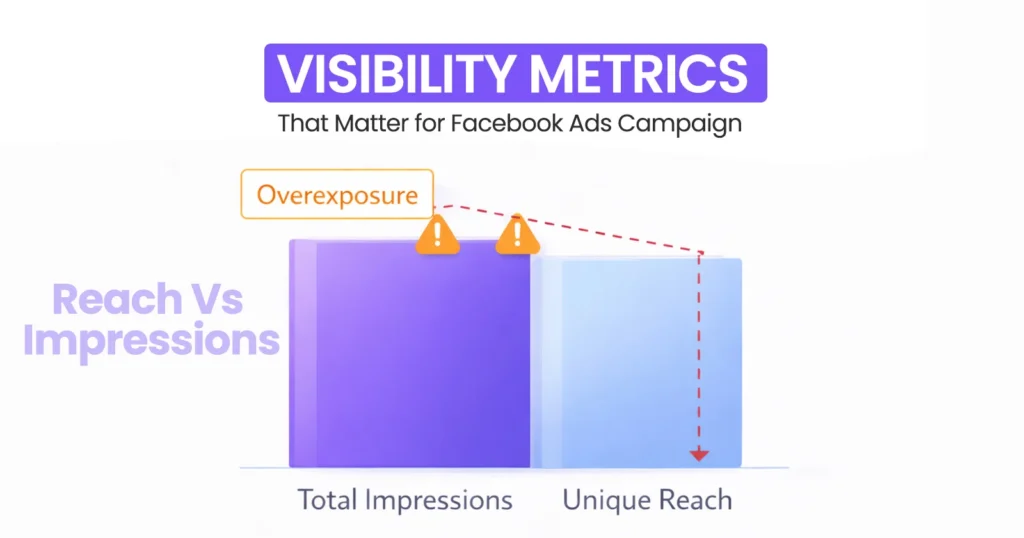
What Are Impressions and How Are They Different From Reach?
Impressions are the total number of times your ad is displayed, including multiple views by the same person. Impressions affect CPM, CTR calculations, and reveal potential overexposure.
High impressions but low reach indicate that your audience is small or being saturated, which can reduce engagement over time. According to social media Today, ad fatigue from repeated exposures can lower CTR and overall campaign effectiveness. (Source: Social Media Today)
| Unique exposure matters more than total impressions.
Monitor reach and frequency carefully to prevent ad fatigue and maintain cost-efficient campaigns.
What Does CTR Actually Tell You About Your Ad Performance?
CTR (Click‑Through Rate) shows how compelling your ad is to the audience that saw it. It is calculated as:
CTR = (Clicks ÷ Impressions) × 100.
A higher CTR usually means your creative, message, and targeting are aligned; people don’t just see your ad, they take action. Meta reports multiple types of CTR in Ads Manager, including CTR (All), CTR (Link), and Outbound CTR. For traffic or conversion‑focused campaigns, CTR (Link) is the most important because it represents clicks leading to your destination rather than engagement with the post itself.
What Is a Good CTR in 2026?
Benchmarking CTR helps you know if your ads are resonating. Across industries, average Facebook CTRs vary, but high‑performing ads often beat these baselines:
| Industry Type | Typical CTR Range |
|---|---|
| E‑commerce | 0.9%–1.5% |
| B2B | 0.5%–1.0% |
| Local Services | 1.0%–2.0% |
| Strong Offers | 2%+ |
Anything above 2 % in cold traffic is strong. For example, if you generate 2,000 link clicks from 100,000 impressions, that’s a 2 % CTR, which suggests the ad message is compelling. If your CTR is consistently below 0.8 %, your creative, targeting, or offer may need improvement.
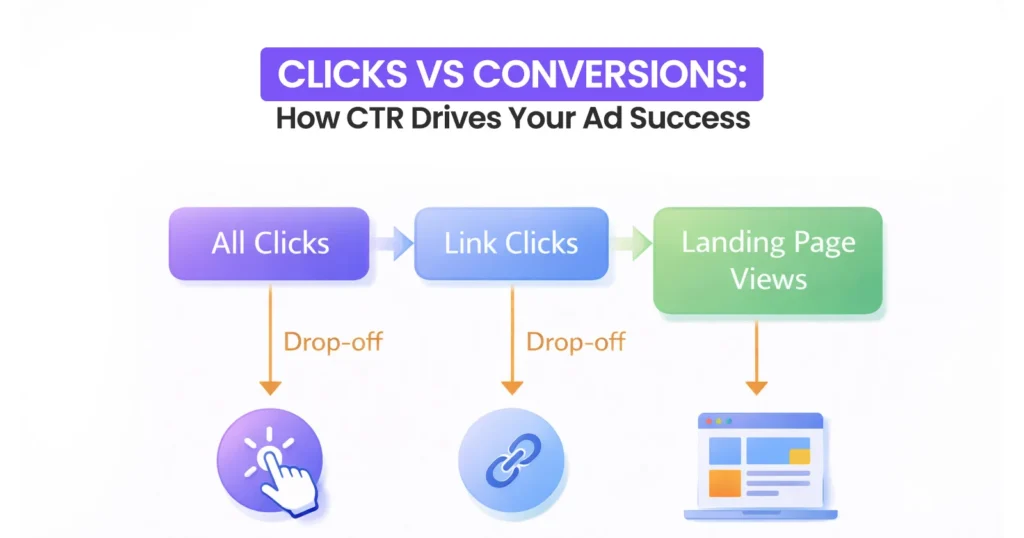
What Do Clicks Really Mean?
Clicks show interest, but not all clicks are equal. Meta categorizes them as All Clicks, Link Clicks, and Landing Page Views. A Landing Page View is stronger than a Link Click because it shows the user actually reached your site, a better signal of intent.
For example, if you record 1,000 Link Clicks but only 700 Landing Page Views, that’s a 30 % drop‑off before your site loads. Possible issues include slow page speed or poor mobile experience.
Industry studies show slow mobile load times can reduce conversions by up to 20 %. It actually highlights why click quality, not just quantity, matters after users leave your ad and land on your page (Studies show slow mobile load times can reduce conversions).
| Always compare Link Clicks vs Landing Page Views.
How Do Cost Metrics Like CPM and CPC Affect Profitability?
Cost metrics show whether your ad spend is efficient, not just how many people saw your ad. Metrics like CPM and CPC reveal audience competitiveness, creative effectiveness, and budget health. While impressions and clicks are important, cost metrics link directly to profitability, helping you decide whether a campaign is sustainable or burning cash.
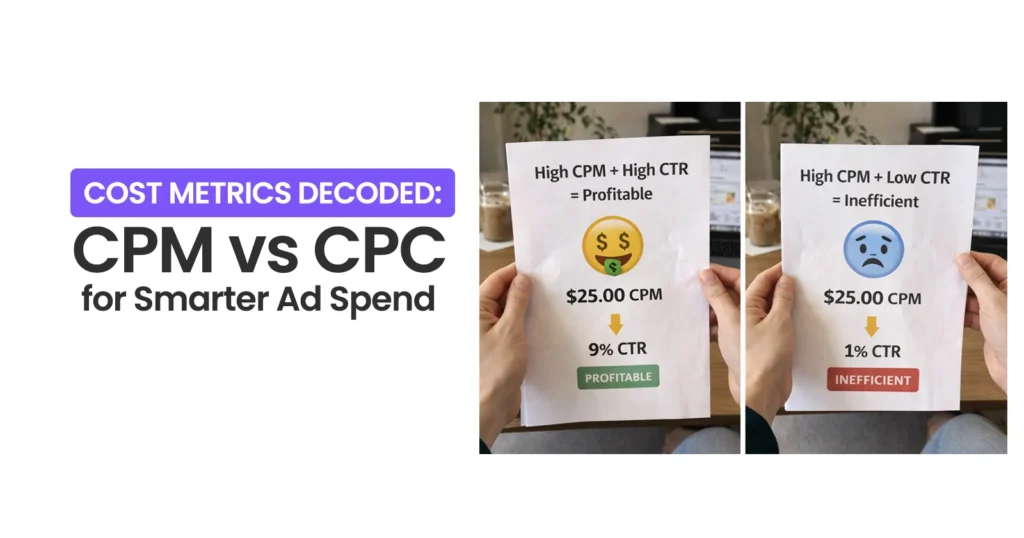
What Is CPM and Why Does It Fluctuate?
CPM (Cost per 1,000 Impressions) is calculated as:
CPM = (Total Spend ÷ Impressions) × 1,000
It indicates how much you pay to reach 1,000 people. CPM fluctuates based on audience demand, seasonality, and competition. High CPM doesn’t automatically signal failure. If your ad maintains a strong CTR, a higher CPM may still deliver profitable results. Conversely, high CPM coupled with low CTR means your budget isn’t working efficiently, and adjustments are needed, whether through targeting, creative, or timing.
What Is CPC and How Should You Interpret It?
CPC (Cost per Click) shows how much each click costs:
CPC = Total Spend ÷ Clicks
CPC depends on CTR, CPM, and competition. High CTR reduces CPC, while low CTR increases it. Lower CPC is desirable, but only if clicks lead to conversions. A cheap click with no leads or purchases isn’t truly cost-effective. Testing creatives, offers, and audience segments directly affects CPC and helps maintain both cost efficiency and profitability of ads.
| High CTR with reasonable CPM usually signals a healthy campaign.
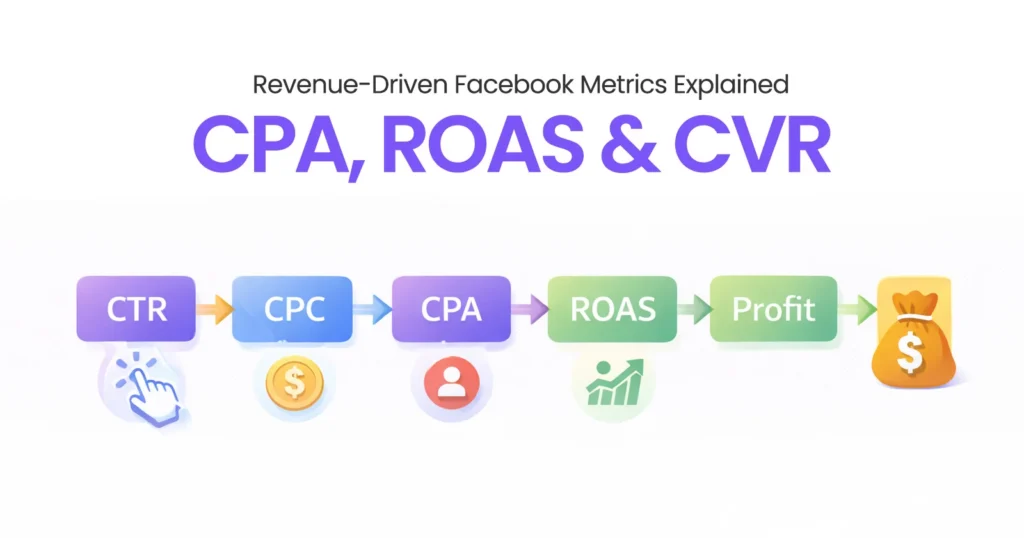
What Metrics Actually Drive Revenue: CPA, ROAS & Conversion Rate?
Clicks alone don’t guarantee profit. True revenue comes from metrics that measure results, CPA, ROAS, and Conversion Rate. These metrics connect ad performance to actual business outcomes, helping advertisers spend smarter and scale efficiently. Understanding them prevents wasted budget and focuses campaigns on profitability rather than vanity metrics.
What Is CPA (Cost Per Result)?
CPA measures the cost of achieving your campaign goal, whether that’s a purchase, lead, or signup:
CPA = Total Spend ÷ Number of Desired Outcomes
For example, if your spend is $1,000 and you get 50 purchases, your CPA = $20. Lower CPA is better, but only in relation to your profit margins. A product with a $60 margin is profitable at $20 CPA, but a $50 CPA would be risky. CPA helps identify campaigns that generate real business value rather than just clicks.
What Is ROAS and What’s Considered Good?
ROAS (Return on Ad Spend) = Revenue ÷ Ad Spend
Example: Spend $1,000, Revenue $4,000 → ROAS = 4x. ROAS benchmarks vary by business model:
| Business Model | Strong ROAS |
|---|---|
| E-commerce | 3–5x |
| Dropshipping | 2–3x |
| High Margin Brand | 5x+ |
ROAS depends on margins, lifetime value, and backend sales. Focus on profitable ROAS, not just cheap clicks.
What Is Conversion Rate (CVR) and Why It Connect Everything?
CVR = Conversions ÷ Clicks
For example, 1,000 clicks leading to 50 purchases → CVR = 5%. A high CTR but low CVR signals issues like slow checkout, landing page problems, or offer mismatch. CVR links engagement with revenue, revealing where ad campaigns fail or truly succeed.
CPA, ROAS, and CVR are the metrics that drive profitability. Tracking these ensures your campaigns convert traffic into real business outcomes.
How Should You Analyze a Facebook Campaign Report Step-by-Step?
Analyzing a Facebook campaign report can feel overwhelming, but using a structured framework simplifies the process. Focus on delivery, engagement, efficiency, and profitability to identify issues early and optimize effectively. Step-by-step analysis allows you to connect metrics to business outcomes rather than just looking at numbers in isolation. Following this sequence ensures campaigns are performing efficiently and generating measurable results.
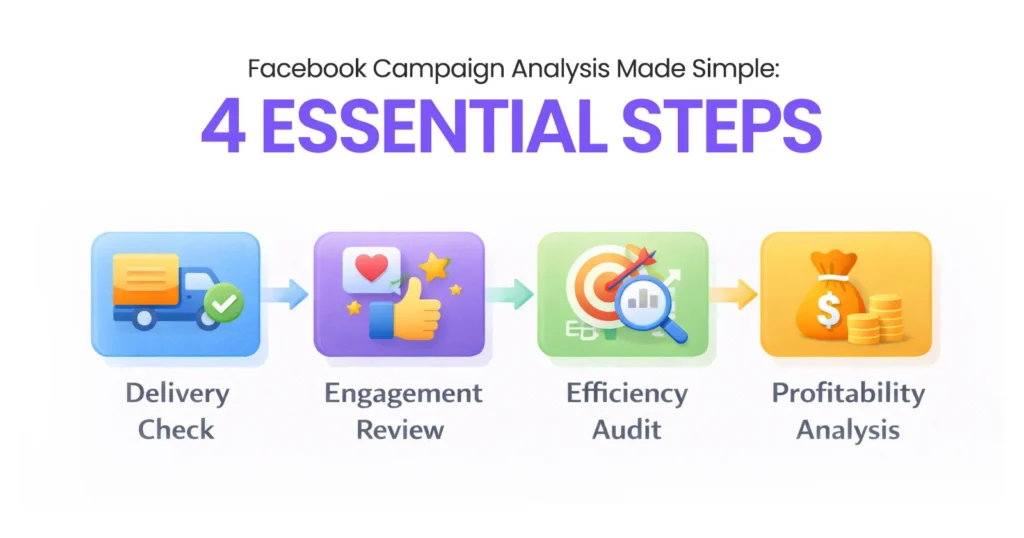
Step 1: Check Delivery
Start by assessing whether your campaign is delivering as planned. Confirm that the ad budget is being spent correctly and that CPM remains within a healthy range. Monitor frequency carefully if the same audience sees your ad too often; engagement can drop, and costs can spike. Proper delivery checks lay the groundwork for interpreting all other metrics effectively.
Step 2: Check Engagement
Next, examine how your audience is interacting with your ads. Look at CTR to gauge creative effectiveness and messaging relevance. Compare Link Clicks to Landing Page Views to ensure clicks translate into meaningful engagement. This step helps identify weak creatives or misaligned targeting before you scale spend.
Step 3: Check Efficiency
Evaluate cost metrics like CPC and CPA to determine financial efficiency. High clicks with low results signal wasted spend. Efficiency analysis ensures that ad dollars generate real value relative to your campaign goals and margins.
Step 4: Check Profitability
Finally, connect performance to revenue outcomes. ROAS and conversion rate show whether campaigns are profitable and scalable. High CTR is meaningless without conversions, so profitability checks are essential for sustainable growth.
Quick Diagnostic Table
Use this quick diagnostic table to identify common campaign issues and their solutions.
| Problem Scenario | Likely Issue | Fix |
|---|---|---|
| High CPM | Competitive audience | Broaden targeting |
| Low CTR | Weak creative | Test new hooks |
| High Clicks, Low Sales | Landing page issue | Optimize page |
| High Frequency | Ad fatigue | Refresh creatives |
| Good CTR, High CPC | Expensive niche | Refine targeting |
What Mistakes Do Most Advertisers Make When Reading Reports?
Even experienced advertisers often misread campaign reports because they focus on the wrong numbers. Understanding metrics in isolation or neglecting key indicators can lead to wasted budget, missed opportunities, and poor scaling decisions. Avoiding these common mistakes helps ensure campaigns perform efficiently and drive real business results.
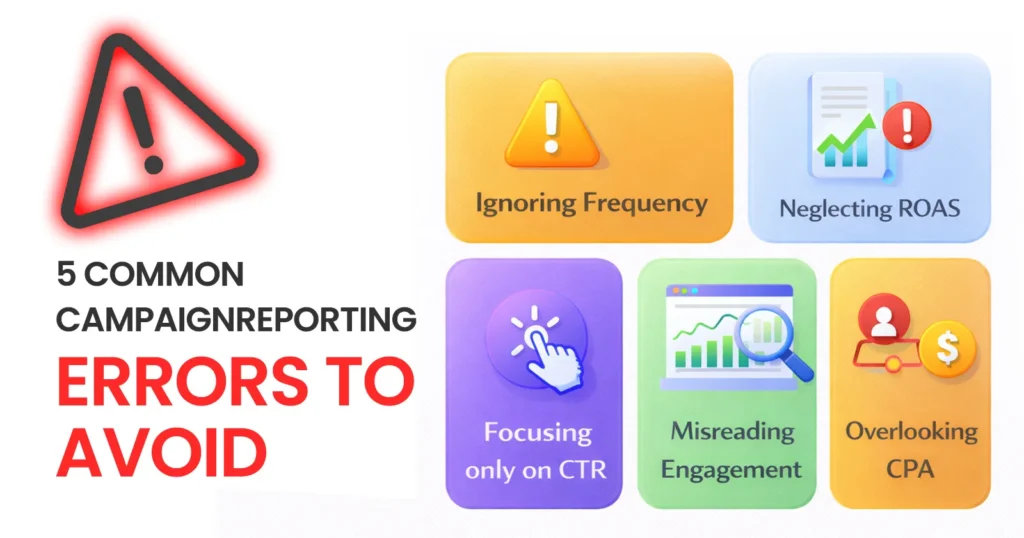
Common Mistakes:
- Obsessing over Reach: High reach doesn’t always mean engagement or conversions.
- Ignoring Frequency: Repeated exposure can cause ad fatigue and rising CPC.
- Focusing only on CTR: Clicks alone don’t guarantee profitable outcomes.
- Not checking Landing Page Views: Clicks without conversions signal funnel issues.
- Scaling without ROAS validation: Expanding spend without profitability insight risks losses.
The most misunderstood Facebook campaign metrics are often the simplest.
| Data without interpretation leads to wasted spend.
How Can ShortVids Help You Master Facebook Campaign Metrics?
Analyzing Facebook campaigns can be complex, especially when multiple metrics interact, and small inefficiencies affect profitability. That’s where ShortVids comes in. Our team helps brands interpret CTR, reach, CPC, CPM, and ROAS accurately, diagnose underperforming ads, and implement creative and targeting optimizations that drive measurable results.
From generating high-quality traffic to boosting conversions, we turn raw ad data into actionable strategies. With ShortVids, you don’t just read reports, you learn to scale campaigns confidently, improve ROI, and make data-driven decisions that grow your business.
Case Study Example: ShortVids helped Ramp boost engagement and ad performance using optimized video creatives and precise targeting. The campaign achieved a 320% increase in unique visitors and a 10× rise in ad interactions, showing how strategic video ad content improves CTR, engagement, and ROI. This case underscores the power of creative optimization in driving measurable Facebook campaign results.
Your Takeaway!
Reading Facebook campaign metrics isn’t about memorizing numbers. It’s about understanding relationships between visibility, engagement, cost, and profitability. Stop chasing vanity metrics. Focus on the ad data that drives revenue. Audit reports weekly, test creatives aggressively, and optimize beyond clicks. Scale smarter with ShortVids and turn your ad data into actionable insights and measurable growth today!
Frequently Asked Questions
It depends on your goal. For traffic, CTR and CPC matter. For sales, CPA and ROAS are primary.
Yes, 0.9–1.2% is average across industries. 2%+ is considered strong for cold traffic.
Above 5 in cold audiences can indicate fatigue. Retargeting can tolerate a higher frequency.
Your CPM may be high due to audience competition.
Landing Page Views are more accurate for traffic analysis.
Book a Call Today
- Fixed monthly plans starting at $999
- 24-hour turnaround time (or less) on all short-form edits
- 3-layer quality check system on every video
- No more chasing freelancers or managing editors
- Scale up to 50+ videos/month without hiring in-house
- Content team trained on platform trends, scroll-stopping hooks & storytelling
- Fully managed by professionals – you just upload & approve
- Response time: Under 1 hour (US & GCC time zones)
Cut your production costs, not your standards.