

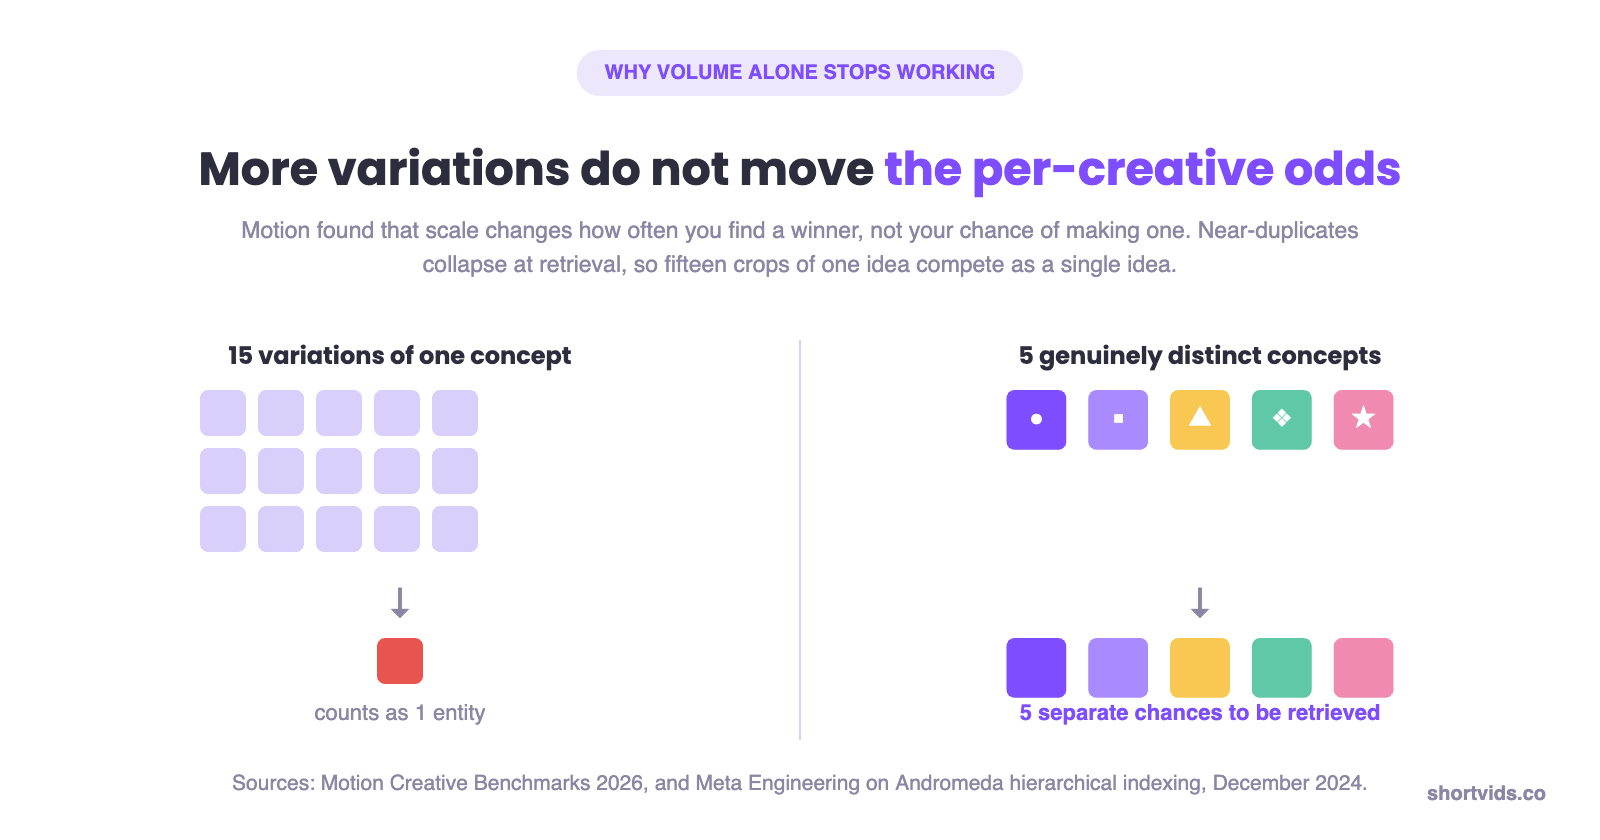
Short answer: Creative diversity is the number of genuinely distinct ad concepts an account tests, not the number of files it ships. It is the benchmark that matters in 2026 because 80 percent of Meta creatives never reach 100,000 impressions, and near-duplicate variations collapse into one entity at the retrieval stage, so fifteen crops of one idea compete as a single idea.
Quick Summary
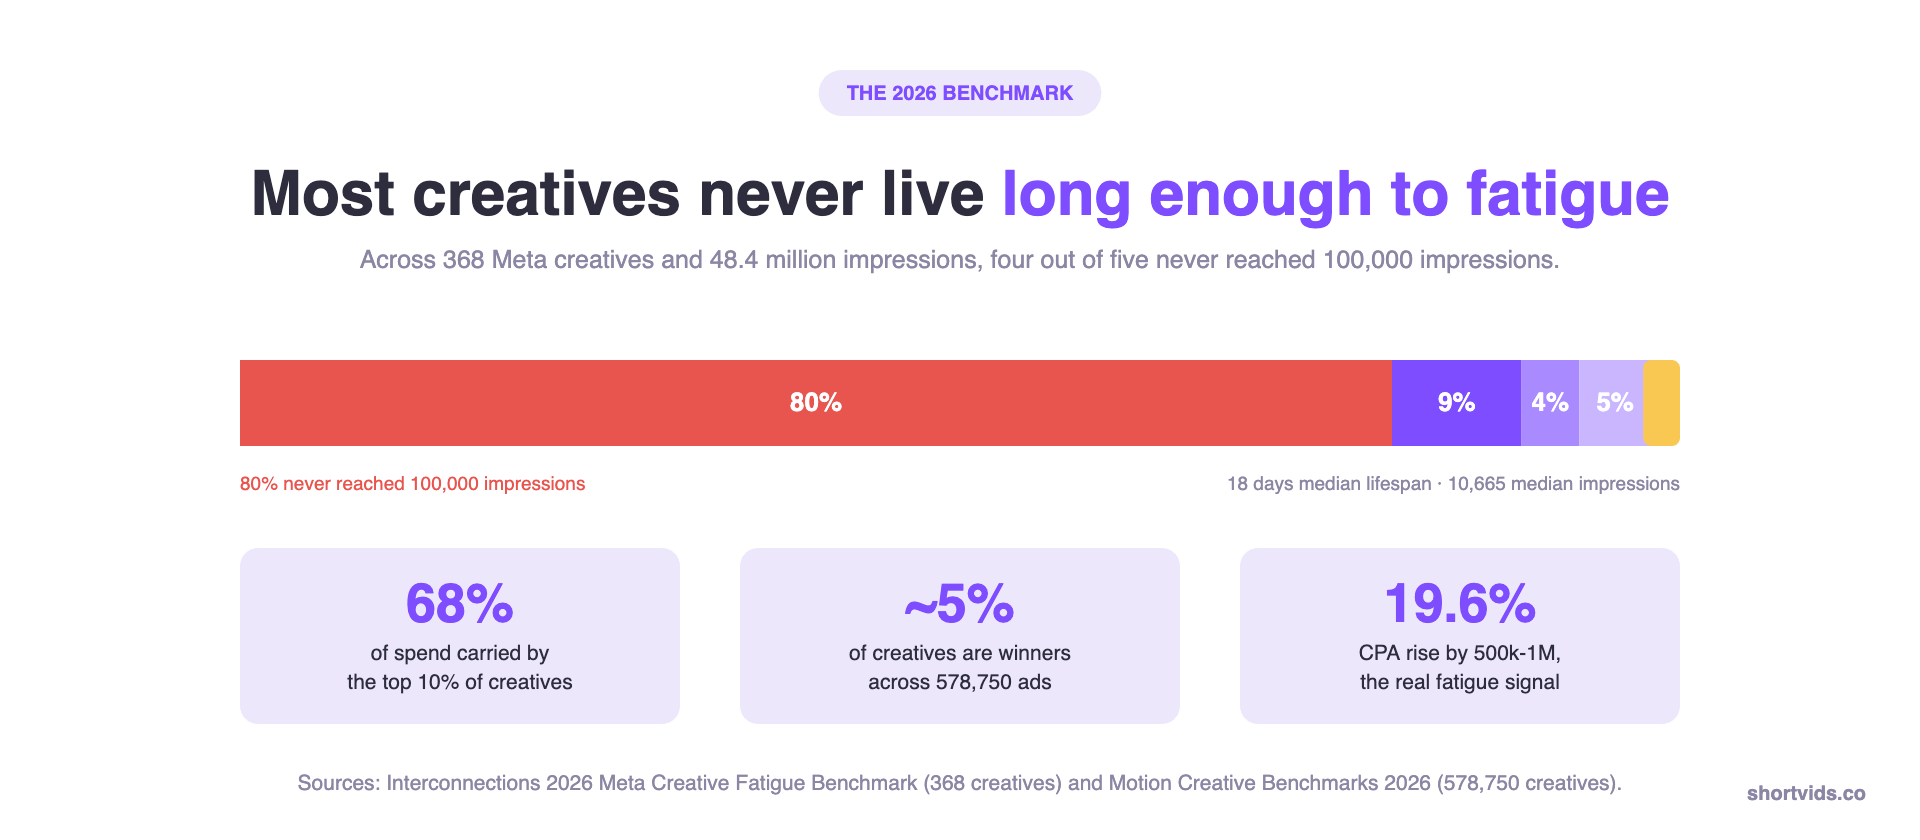
TL;DR: Across 368 Meta creatives and 48.4 million impressions, 80 percent never reached 100,000 impressions and the median creative was live 18 days. Most ads do not fatigue. They die of not working. Separately, Motion’s analysis of 578,750 creatives found that roughly 5 percent become winners and that testing more does not improve your odds on any single creative, it just buys more attempts. Put those two findings together and the 2026 benchmark stops being refresh cadence and becomes creative diversity: how many structurally different concepts you can put into the auction.
ShortVids is a creative production partner, not a media buyer. We build the concepts, the videos and the variants. Your team or your existing buyer runs the campaigns and owns the ad account. This article is about what to produce and why, not about how to structure your campaigns.
Running out of concepts before you run out of budget is the most expensive bottleneck in paid social. Book a call with us and we will look at your current creative mix.
What Is Creative Diversity?
Creative diversity is the count of structurally distinct concepts running in an account, measured by how different they are in angle, hook, format and proof rather than by how many files exist.
The distinction is not academic. Five hooks on the same founder clip, five crops of the same product shot and five colourways of the same static are twenty files and one idea. Five genuinely different concepts might be a customer testimonial, a problem demonstration, a price comparison, a founder explanation and a before and after. Same file count, completely different exposure to the auction.
Diversity is also not the same as volume. Volume is how much you ship. Diversity is how much of what you ship is actually new. An account can have high volume and almost no diversity, and that combination is the single most common pattern we see.
Most Creatives Die Before They Can Fatigue
The fatigue conversation assumes a creative lives long enough to wear out. For most, that assumption is simply false.
Interconnections published a first-party benchmark in August 2026 covering 368 Meta creatives across 15 DTC brands, 48,450,354 impressions and $685,791 of spend between 8 April and 11 August 2026. The headline finding is blunt: 80 percent of those creatives never reached 100,000 impressions, and 89 percent never reached 250,000.
The median creative was live 18 days and delivered 10,665 impressions in its entire life. A quarter were finished inside six days having delivered 524 impressions.
| Percentile | Active days | Lifetime impressions |
|---|---|---|
| 25th | 6 | 524 |
| Median | 18 | 10,665 |
| 75th | 46 | 74,418 |
| 90th | 76 | 293,876 |
Worth stating the limitation the authors state themselves: their warehouse retains the top-spending ads per account, so the very long tail of immediately-killed creatives is under-represented. That makes 80 percent a conservative floor rather than a ceiling. The window is also four months, so seasonality is not separated out.
A different dataset points the same way. AdSpyder’s May 2026 archive analysis of 24,650 ads found a median observed run of just 4 days on Meta across a 4,000 ad sample, with 29.8 percent surviving 30 days or more. AdSpyder is explicit that observed duration is a floor estimate drawn from first-seen and last-seen dates, not confirmed campaign lifetime, and that longevity is not the same as profitability. Different method, same shape.
Four Things You Were Told About Fatigue
The Interconnections study tested the received wisdom directly, and most of it did not survive.
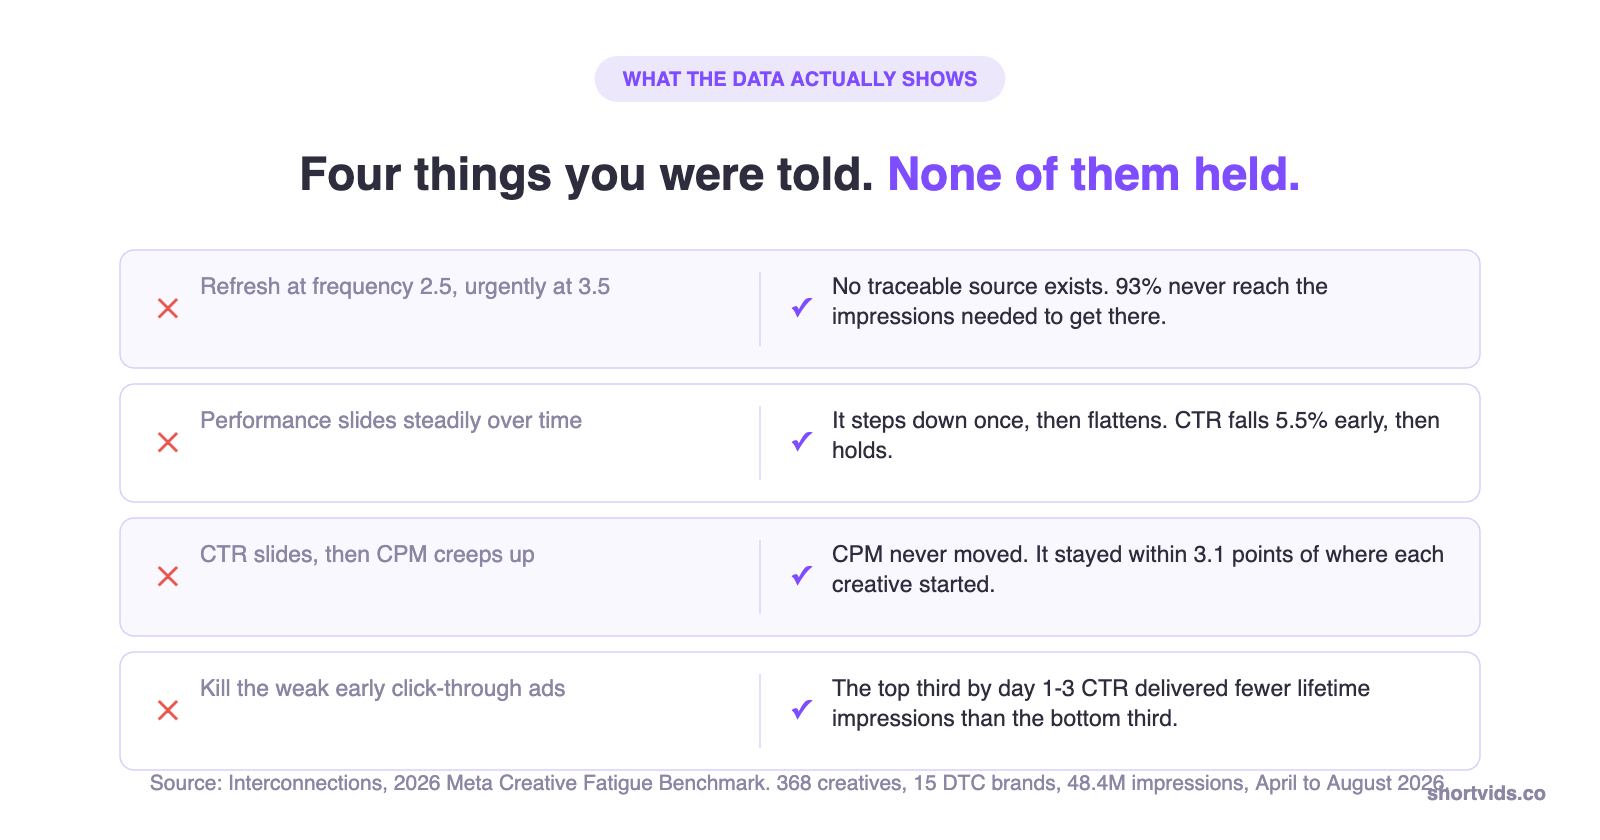
The frequency thresholds have no source. Refresh at 2.5, urgently at 3.5. Everyone repeats it. Interconnections went looking for the origin and could not find one, describing the numbers as folklore that became convention through repetition. They are careful here, and so are we: their data cannot refute the thresholds, because measuring frequency needs reach data they did not have. What they can show is that 93 percent of creatives never delivered the impressions required to reach frequency 2.5 against even a modest audience. The threshold describes a stage of life most ads never see.
Decay is a step, not a slide. Click-through fell 5.5 percent inside the first 250,000 impressions and then held roughly flat, ending at minus 8.2 percent by the 500k to 1M bucket. The mental model of continuous decline does not match the curve.
CPM did not move. It stayed within 3.1 percentage points of where each creative started across the entire published range. The familiar sequence where frequency climbs, CTR slides and then CPM creeps up never happened. CPM is an auction signal about competition and audience supply, not a report card on your creative’s age.
Early click-through predicted nothing. Splitting 86 creatives by their first three days of CTR, the top third went on to deliver a median 167,847 lifetime impressions against 324,522 for the bottom third. Not a weak relationship. Not even pointing the right way. With 29 creatives per group this is a small sample, which is exactly why the authors state it as a negative finding rather than attaching an effect size to it.
If you kill creatives on a three-day CTR read, you are using a heuristic that did not work in the one dataset that bothered to test it.
Winners Are Rare, and Volume Does Not Change Your Odds
If most creatives die early, the question becomes how often you find one that does not.
Motion’s Creative Benchmarks 2026 analysed $1.29 billion in Meta ad spend across 578,750 creatives and 6,015 advertiser accounts, covering 1 September 2025 to 1 January 2026. Around 5 percent of creatives qualify as winners, defined in Motion’s methodology as spending at least 10 times the account median with a $500 floor. That 10x bar sits at roughly the 92.3rd percentile, so only about 7.7 percent of creatives clear it.
Spend follows the winners hard. Across the dataset, 55 percent of total Meta spend lands on winning creatives, rising from 23 percent at Micro accounts to 64 percent at Enterprise. Interconnections found the same concentration from its own angle: the top 10 percent of creatives carried 68 percent of spend, the top 20 percent carried 84 percent, and the bottom half accounted for about 1 percent.
Now the finding that reframes everything. Motion’s own summary of the scale data is that volume “creates more chances to surface a winner” but “the per-creative odds don’t change”. Enterprise accounts launch about 18.8 creatives a week against roughly 2.8 at Micro. They find more winners because they take more shots, not because their shots are better.
Read carelessly, that is an argument for brute-force volume. It is not, and this is where creative diversity enters.
Motion is also clear that its report does not tie outcomes to ROAS, revenue or conversion. It measures where Meta’s auction allocates budget inside an account. That is a real limit on how far you can push the conclusion, and we are not going to push it further than it goes.
Why Near-Duplicates Do Not Count as Extra Shots
Here is the mechanism that joins the two findings together.
Retrieval is the first stage of Meta’s ads system. Meta’s own engineering team describes it as selecting from tens of millions of ad candidates down to a few thousand, before heavier ranking models decide what actually gets shown. Andromeda is the system that does the selecting, built on a custom deep neural network running on NVIDIA Grace Hopper hardware, which Meta credits with a 6 percent recall improvement and an 8 percent ads quality improvement on selected segments.
The part that matters for creative teams is the indexing. Meta built what it calls a hierarchical index specifically “to support exponential ad creatives growth”, organising ads into layers so the system only has to inspect the most relevant nodes. Meta notes that more than a million advertisers used its generative AI tools to make over 15 million ads in a single month. The index exists because the volume of near-identical machine-made creative exploded.
So if you ship fifteen crops of one concept, you have not bought fifteen shots at the 5 percent winner rate. You have bought something much closer to one, because those assets occupy nearly the same position in the index and compete for the same slot. Volume without diversity is the appearance of testing.
Two honest caveats. Meta has never published a public threshold for how similar is too similar, and any specific “creative similarity score” number you see quoted does not come from Meta. The performance figures above are Meta’s own disclosures about its own system, which is not the same as independent verification.
Meta Is Telling You Where This Goes
The clearest signal is in Meta’s own closing paragraph on Andromeda. Describing what comes next, the engineering team writes that the architecture is expected to move to an autoregressive loss function “leading to a more efficient and faster inferencing solution that delivers a more diverse set of ad candidates”, adding that “increased ad diversity can improve people’s experience with ads and drive better advertiser outcomes”.
Diversity is not a tactic someone invented to sell creative production. It is the stated direction of the platform’s own retrieval roadmap, written by the people building it. Meta has continued down this path, publishing on its Generative Ads Model in October 2026 and on multi-stage ads ranking in August 2026.
We covered how this changes testing method in our Meta Andromeda creative testing guide, and the volume and fatigue benchmarks in our Facebook ad creative guide.
Free swipe file
Steal 150+ proven Meta ads that generated millions for the world’s top brands and agencies.
How to Measure Creative Diversity in Your Own Account
Diversity is only a useful benchmark if you can count it. Here is the audit we run.
Take every ad that delivered in the last 60 days and tag each one on four axes.
| Axis | What it captures | Examples |
|---|---|---|
| Angle | The argument the ad makes | Price, speed, status, risk reversal, problem cost |
| Hook | The first two seconds | Question, bold claim, demonstration, pattern break, direct address |
| Format | How it is constructed | UGC, talking head, screen capture, motion graphic, static, carousel |
| Proof | Why anyone should believe it | Testimonial, data, demo, authority, social count |
Then count the unique combinations, not the files. Most accounts discover they have between three and five real concepts behind thirty or forty assets. That is the number that should worry you, and it is usually a production constraint rather than a strategy failure. Nobody decided to run four concepts. They ran out of capacity to make a fifth.
A practical target, and we are labelling this as our judgement rather than a measured finding: aim for at least eight to twelve genuinely distinct combinations in rotation for an account spending meaningfully, with new concepts entering as a steady flow rather than a quarterly batch. We cannot cite a study that proves that exact range. What the data does support is the direction: more distinct concepts, fewer cosmetic variants.
One more rule that follows directly from the evidence. Judge creatives on delivered impressions, not elapsed days. Three days means completely different exposure for an ad at $50 a day and one at $2,000 a day. Give every concept the same delivery before you cut it.
What This Looks Like in Practice
Two of our own engagements show the pattern, and we are going to be careful about what they do and do not demonstrate.
Yoni Rescue is a premium organic ecommerce brand in women’s hygiene and personal care. They came to us with products, a store and an active ad account. What they did not have was a creative system built for continuous testing. The stated problems were not enough creative variety to sustain testing, no structured process for testing hooks and concepts against each other, no in-house team to produce multiple formats at volume, and a varied catalogue where each product needed its own treatment.
We built across graphic ads, carousels, AI-generated video, real UGC and cinematic content, deliberately spanning formats rather than iterating one. The line from that project that has stuck with our team: the goal was never more content, it was more opportunities to find winning ads. That was written before we had read either benchmark above, and it is the same conclusion.
Kyber Consulting, an agency run by Jay Miller, had the opposite shape of the same problem. Plenty of clients, campaigns, footage and ideas, and not enough editing capacity behind them. They needed existing footage repurposed into distinct shorts with different hooks and CTAs that could be tested as ads across multiple client accounts.
What these do not prove. Neither case study publishes before and after performance figures, so we are not claiming a lift from either. They illustrate the constraint and the response, nothing more. Both clients changed more than one variable at once. Treat them as the shape of the problem rather than as evidence of an outcome.
What This Article Does Not Establish
Being straight about the limits is what makes the rest worth reading.
No study cited here tests creative diversity against revenue directly. Motion measures spend allocation and explicitly does not tie outcomes to ROAS or conversion. Interconnections measures delivery and cost per acquisition across 15 DTC brands, which is a narrow slice of advertisers. The diversity argument is an inference built on top of those findings and on Meta’s description of how retrieval indexes ads. It is a well-supported inference. It is not a controlled experiment, and we have not seen one.
We also cannot tell you the exact similarity threshold at which Meta treats two ads as the same thing, because Meta has not published it and anyone who quotes you a precise number is guessing.
What we would say with confidence: refresh cadence is the wrong headline metric, hit rate is the right one, and the lever on hit rate is how many genuinely different ideas you can get into the auction.
Where ShortVids Fits
We are the production half. ShortVids builds Meta and Instagram ad creative at concept level: different angles, different hooks, different formats, different proof structures, plus the iterations on whatever starts working. We do not run your ad accounts and we do not touch your media buying.
That split is deliberate. If your campaigns are badly structured, a creative partner will not fix it and we will tell you so. If you are running four concepts because you cannot produce a fifth, that is the problem we exist to solve. Pricing is on the pricing page and examples are in the portfolio.
Want to know how many real concepts are actually running in your account? Book a call and we will audit your last 60 days against the four axes above, on your real ads rather than a generic example.
Frequently Asked Questions
What is creative diversity in advertising?
Creative diversity is the number of structurally distinct ad concepts an account runs, measured across angle, hook, format and proof rather than by file count. Twenty assets built from one idea is low diversity. Five assets built from five different arguments is higher diversity, even though it is a quarter of the output.
Why is creative diversity the most important benchmark in 2026?
Because the two things that decide paid social outcomes are hit rate and the auction’s ability to retrieve your ads. Roughly 5 percent of creatives become winners and 55 percent of spend lands on them, per Motion’s analysis of 578,750 creatives. Near-duplicate assets do not multiply your chances of producing one, because they occupy nearly the same position in Meta’s retrieval index. Distinct concepts do.
How many ad creatives should I run per month?
Motion’s data shows Enterprise advertisers launching about 18.8 creatives a week against roughly 2.8 at Micro accounts, and notes that top-quartile accounts in each tier test substantially more than their peers. Those are observed averages, not a quota. The more useful question is how many distinct concepts sit behind whatever number you ship.
Is creative fatigue real?
Yes, but it is smaller and later than most people think, and it affects far fewer ads. In the Interconnections benchmark, cost per acquisition rose 19.6 percent by the 500k to 1M impression mark and stayed elevated, while click-through fell 5.5 percent early and then flattened. The larger issue is that 80 percent of creatives never delivered enough impressions to fatigue at all.
Should I refresh Meta creative at frequency 2.5 or 3.5?
Those thresholds have no traceable source. Interconnections went looking and could not find one, and labels them folklore. Their data cannot disprove the numbers, because frequency needs reach data the study did not hold. What it does show is that 93 percent of creatives never reached the impression volume needed to hit frequency 2.5 against a modest audience.
What should trigger a creative refresh?
Cost per acquisition against your target. That is where the durable 19.6 percent move showed up in the data. Click-through moves early, moves a little and then goes quiet, which makes it a poor trigger. Rising CPM is an auction and audience signal, not a creative one.
Does CPM rise as a creative gets older?
Not in this dataset. CPM stayed within 3.1 percentage points of where each creative started across the entire published range. If your CPM is climbing, look at competition, audience size and seasonality before you blame the creative.
Can I judge a creative in its first three days?
Not on click-through. Splitting 86 creatives by first-three-day CTR, the top third went on to deliver a median 167,847 lifetime impressions against 324,522 for the bottom third. The heuristic did not work and did not even point the right way. Judge on delivered impressions instead, so every concept gets equal exposure before you cut it.
How does Meta Andromeda affect creative strategy?
Andromeda is the retrieval stage that narrows tens of millions of candidate ads to a few thousand. Meta built a hierarchical index for it specifically to handle exponential growth in ad creative volume. Practically, that rewards concepts that occupy genuinely different positions in the index and offers little to near-identical variants of one asset.
Is more creative volume always better?
No, and this is the most common misreading. Motion found that scale changes how often you find a winner without changing the per-creative odds. More shots help only if the shots are actually different. Volume made of cosmetic variants buys you production cost and very little else.
What is the difference between creative diversity and creative volume?
Volume is how many assets you ship. Diversity is how many distinct ideas those assets represent. An account shipping 40 assets a month from three concepts has high volume and low diversity. Diversity is the one that correlates with the thing you actually want, which is more independent chances at a winner.
Who should own creative production, the agency or the brand?
Either works. What matters is that production capacity is not the thing capping your concept count. If you are reusing the same three ideas because making a fourth takes three weeks, the constraint is capacity rather than strategy, and that is solvable with an in-house hire or a production partner.