

Quick Summary
TL;DR: Most YouTube creators are sitting on a goldmine of performance data and doing absolutely nothing with it. Creators should focus on metrics like watch time, average view duration, CTR, audience retention, traffic sources, and subscriber growth, rather than just views. ShortVids helps brands and creators turn useful insights into consistent, high-performing content that compounds over time. #tldr
- Core Components: Accessing YouTube Analytics → CTR and thumbnail optimization → Watch time and retention improvement → Traffic source leverage → Audience demographic targeting → Competitor benchmarking → Revenue metric tracking → Engagement signal optimization → Analytics-driven content calendar → ShortVids execution support.
- Outcome: Creators and brands that master YouTube Analytics stop guessing and start growing, producing content that the algorithm actively rewards, audiences genuinely watch, and channels that build sustainable revenue.
Stop Posting Blind; Let Data and ShortVids Drive Your Growth!
Posting consistently and still not growing isn’t a content problem, it’s an analytics problem. Over 500 hours of video are uploaded to YouTube every single minute, and the channels rising above that noise aren’t the ones working hardest. They’re the ones reading their data correctly and making smarter decisions because of it.
Views are the most visible metric on YouTube and the most misleading. A video can accumulate thousands of clicks and still tank in algorithmic reach because watch time, retention, and engagement signals tell a completely different story. The YouTube channels generating real subscriber growth and revenue in 2026 are the ones treating analytics as a strategic growth tool, not an afterthought.
This guide breaks down every metric that matters, shows you exactly how to extract actionable insights from your data, and demonstrates how ShortVids helps brands and creators execute on those insights with content that performs consistently not just occasionally.
What YouTube Analytics Actually Is and Why Ignoring It Is Costing You Growth
YouTube Analytics is the built-in reporting system inside YouTube Studio that helps creators, brands, and businesses understand how their content is performing. It collects and presents data in the form of analytics metrics, giving you a clear picture of what’s working and where you might need to adjust. Instead of guessing why one video took off while another fell flat, these insights show you the real reasons behind audience behavior.
For creators, knowing these numbers is critical because growth on YouTube is rarely about luck. You can also pair these insights with the right video editing tools to polish your content and make it more appealing to the audience you discover through YouTube Analytics. Brands and businesses also rely on the same data to connect content with goals like visibility, conversions, or revenue. When you track the right metrics, you move from creating content blindly to building a strategy based on evidence.
Here are just a few of the key things you can measure inside YouTube Analytics.
- Views – how many people have watched your videos
- Watch Time and Retention – how long viewers stay engaged
- Click-Through Rate (CTR) – how often people click after seeing your thumbnail
- Audience Demographics – check the age, location, and interests of your viewers
- Revenue Reports – an eye on earnings from ads, memberships, and other monetization
- Traffic Sources – where your viewers are finding your videos
Every one of these metrics is an instruction. The brands and creators acting on these instructions consistently are the ones building channels that grow with compounding momentum and ShortVids helps clients execute on every insight their analytics surface.
Let ShortVids Execute on Your Analytics!
How to Access YouTube Analytics on Desktop, Mobile, and Third-Party Tools
The good news is that checking your channel’s performance doesn’t require any complicated setup. YouTube Analytics metrics are available to every creator through YouTube Studio, and you can view them on both desktop and mobile. Whether you’re at your desk planning a content calendar or on the go checking how your latest upload is doing, there’s a simple way to stay on top of your numbers.
On Desktop
The easiest way to start is by logging into YouTube Studio from your browser. Once inside, the left-hand menu has an “Analytics” tab. You will start on a dashboard that shows key information like views, watch time, and subscriber changes. To dig deeper, switch to advanced mode. Here, you can filter results by date range, compare how different videos perform, and see detailed sources of traffic.
On Mobile (YouTube Studio App)
For channel management, the YouTube Studio app is the most convenient tool. Just open the app and tap “Analytics” to get a quick overview of your performance, including top videos, audience demographics, and real-time views. It’s especially useful for creators looking to respond to trends or adjust their posting schedules.
Using Third-Party Tools
A lot of creators stick with YouTube Studio, but using third-party tools can give you some extra insights that are pretty helpful. For example, VidIQ and TubeBuddy are popular for keyword research and optimization, while Social Blade helps benchmark against competitors. Publer goes a step further by combining scheduling with analytics, and Google Analytics can tie video traffic back to your website activity.
If you want to go beyond YouTube and see how your videos support bigger business goals, tools like Google Analytics can help connect the dots, similar to how brands track marketing performance across multiple channels.”
Here’s a quick comparison table.
| Tool | Best For | Free/Paid |
|---|---|---|
| YouTube Studio | Native analytics | Free |
| VidIQ | SEO + keyword insights | Free & Paid |
| TubeBuddy | Optimization + competitor tracking | Free & Paid |
| Publer | Scheduling + analytics | Paid |
| Social Blade | Competitor benchmarking | Free & Paid |
The YouTube Analytics Metrics That Actually Drive Channel Growth
To grow your channel, getting views is just the first step. The real benefit is in checking YouTube Analytics. This tool shows how people find, watch, and interact with your videos. The statistics help you see what works, what doesn’t, and how to make better choices in the future. Let’s walk through the key metrics you’ll want to keep an eye on and how to use them to grow your channel.
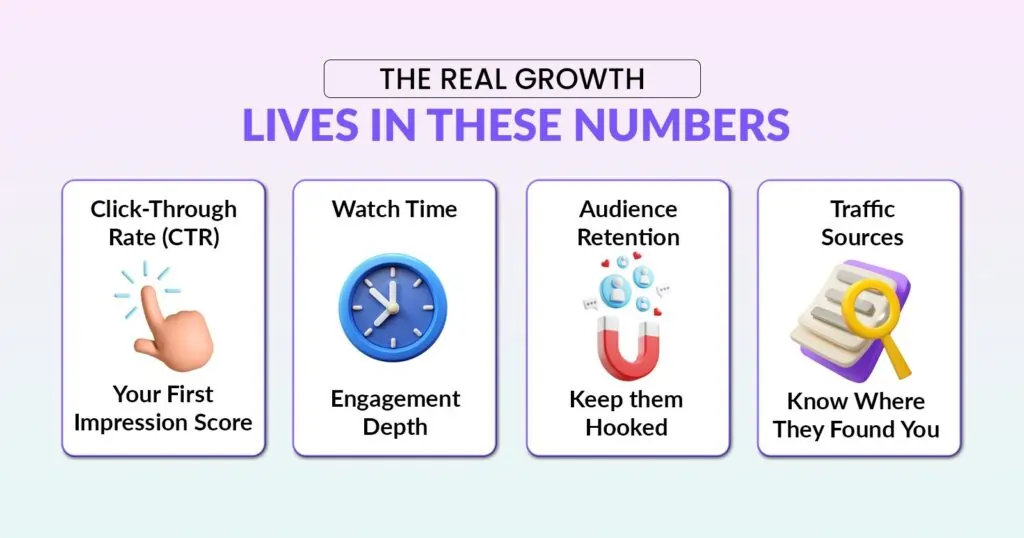
1. Click-Through Rate (CTR)
The most important YouTube analytics metric is CTR. It tells you how often people click on your video after seeing the thumbnail and title. Think of it as your “first impression” score. If your CTR is low, it means people are scrolling past without giving your video a chance.
Why it Matters
The higher your CTR, the more the algorithm will push your video in search results and recommendations.
Best Practices
- Experiment with different thumbnail styles (bold colors, clear text, human faces).
- Write curiosity-driven titles that stay true to the content.
CTR Formula
CTR = (Clicks ÷ Impressions) × 100
Example: If your video shows up 10,000 times and gets 700 clicks, your CTR is 7%.
2. Average View Duration (AVD)
AVD tells you how long people actually stick around once they click. It’s closely tied to retention but focuses on the average across your entire video.
Why it Matters
YouTube wants people to stay on the platform. Videos with higher AVDs send strong signals that your content is engaging.
Example: A 5-minute video where viewers watch 80% (4 minutes) will often outperform a 20-minute video where viewers only stick around for 20% (4 minutes).
3. Watch Time
Watch time is simply the total minutes that people spend watching your videos. Unlike views, this metric shows depth of engagement.
Why it Matters
Videos with higher watch time tend to rank better in search and appear more in suggested videos.
Tips to Increase Watch Time
- Open with a strong hook in the first 10 to 15 seconds.
- Use storytelling to keep viewers curious about what comes next.
- Adjust pacing to avoid long, slow sections.
4. Audience Retention
Audience retention is another one of very important YouTube analytics metrices. It shows how long people stick with your video and where they drop off.
Why it Matters
If many viewers leave in the first 30 seconds, YouTube takes it as a sign that the content didn’t meet expectations.
Inside YouTube Studio, the “Moments for audience retention” report highlights exactly where people rewatched or stopped watching. That feedback is gold for improving your intros and mid-video flow.
5. Traffic Sources
It tells you where your viewers are coming from – search results, suggested videos, browse features, playlists, or even external sites.
Why it Matters
Once you know your strongest traffic source, you can double down on it.
- Search traffic – Focus more on keyword optimization.
- Suggested videos – Create content clusters around successful topics.
- Feature human faces with expressions to make an emotional connection.
For example, if a lot of your external traffic is coming from blogs or educational sites, it’s worth pairing your videos with related written content, like this ChatGPT breakdown guide that explains complex topics in simple terms
6. Subscriber Growth
YouTube shows when and where you gained or lost subscribers. Spikes often mean a particular video hit home, so consider building follow-up content around that format.
Why it Matters
Subscribers are more likely to see future uploads, giving you a built-in audience base.
7. Returning vs. New Viewers
While analyzing your channel’s growth, keeping tabs on this YouTube analytics metric is important. A healthy channel balances both.
- Viewers who return to watch again demonstrate loyalty and are more likely to comment, share, or subscribe.
- New viewers bring fresh growth and discovery.
Tips to Nurture Returners
Create a series, post consistently, and reward engagement by replying to comments.
8. Top Videos Driving Audience Growth
Under the Audience tab in YouTube Studio, you’ll find which videos bring in the most subscribers. These are your “growth drivers.”
Tip: Turn high-performing topics into a series or playlist to keep momentum going.
9. Revenue Metrics (for Monetized Channels)
If your channel is monetized, pay attention to
- Estimated Revenue – total money earned.
- CPM (Cost per Mille) – what advertisers pay per 1,000 views.
- RPM (Revenue per Mille) – your actual earnings per 1,000 views.
- Monetized Playbacks – the number of views with ads.
Tracking these helps you spot which content types are most profitable.
10. Engagement Metrics (Likes, Comments, Shares)
Engagement goes beyond views. Likes, comments, and shares show whether people felt connected enough to respond.
Why it Matters
Strong engagement builds community trust and signals to YouTube that your video deserves more reach.
Quick Tip: Ask viewers to share their thoughts, suggestions, or experiences in the comments. Simple CTAs can make a big difference.
Creators who spark meaningful discussions often see better long-term growth, especially when they share content that explores trending topics such as the role of prompt engineering in content creation.
Audience Insights: Understanding Who’s Actually Watching and When to Reach Them
It’s one thing to know how many people clicked on your video. It’s one thing to understand who those people are, but it’s another to grasp how they interact with your channel. So, audience insights are of great importance. Instead of guessing, you receive real data indicating who is tuning in, when they are most likely to watch, and what devices they prefer.
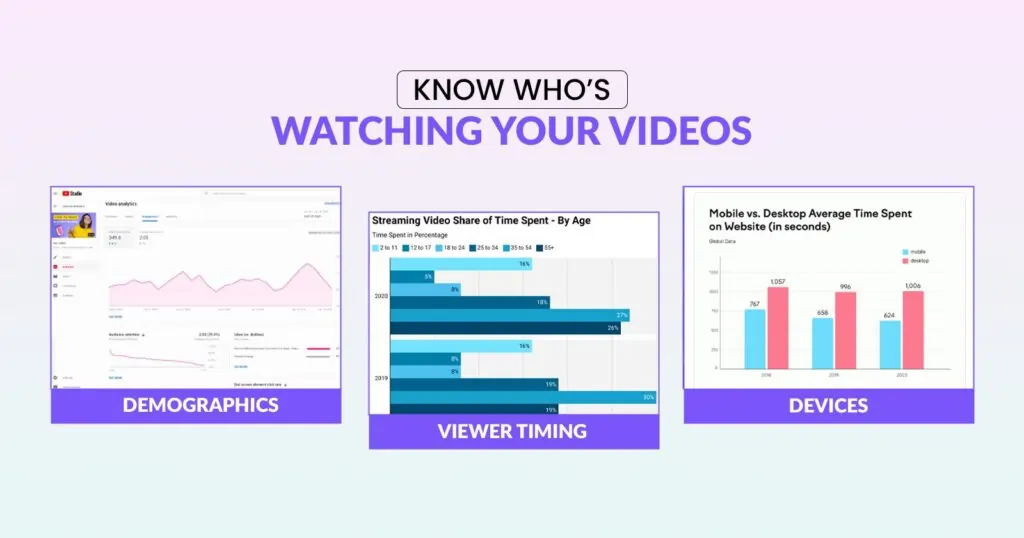
Demographics
YouTube helps you understand your audience by showing their age, gender, and location. This information can greatly affect your content strategy. If most of your viewers are from Generation Z, they will likely enjoy videos with quick edits, popular sounds, and short, engaging hooks. Contrarily, if you have a larger Millennial audience, they might prefer videos that delve deeper into tutorials or product reviews.
Location also matters, as knowing your audience’s time zone helps you decide when to post so your content doesn’t get buried. For instance, if your analytics reveal a younger audience, it helps to study how influencers shape consumer behavior, since trends and buying habits often overlap with content preferences.
When Your Viewers Are Online
Timing makes a bigger difference than most people think. YouTube shows you exactly when your viewers are active, and posting just before those windows can give your video a healthy boost. Imagine publishing at noon when your audience is usually online around 7 PM. Chances are, the video won’t get the early engagement it needs to gain momentum. A small shift in your schedule can help you grab more eyeballs from the start.
Devices Used
Finally, pay attention to how your audience is watching. Many creators assume their viewers are on phones, but sometimes a big chunk of views comes from TVs or desktops. If most of your traffic is mobile, make sure text on screen is readable without squinting.
If viewers lean toward TV, consider how your visuals will appear on a larger screen – low-resolution clips or cluttered layouts will stand out more there. Matching your editing style to your audience’s habits makes your videos easier to watch and keeps people coming back.
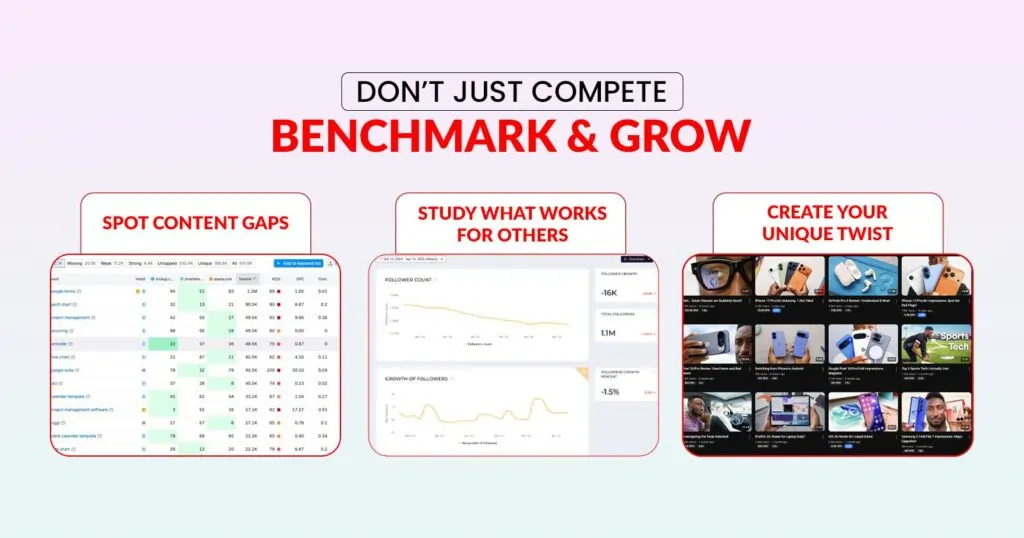
How to Benchmark Against Competitors and Find the Content Gaps Worth Exploiting
Monitoring your own metrics is crucial, but observing successful competitors can drive faster growth. Competitor benchmarking helps you find content gaps, gain inspiration, and understand your channel’s position in the larger landscape.
Here are a few tools that can make the process easier.
- VidIQ provides keyword insights and SEO suggestions, revealing why certain competitor videos rank higher.
- TubeBuddy helps with optimization and competitor tracking, so you can see which tags and formats are driving results.
- Social Blade makes it simple to check growth trends, subscriber milestones, and estimated earnings for other creators.
- Tubular Intelligence provides deeper data on cross-platform performance, helping you see what’s going viral beyond YouTube itself.
For example, if you notice a competitor’s short-form series suddenly taking off, that’s a signal. You don’t copy the content, but you can study the format, timing, and delivery style to craft something original that taps into the same audience interest. If you want inspiration for experimenting with formats, exploring short-form content ideas can give you practical ways to adapt trends to your own style.
Analytics Mistakes That Are Actively Slowing Your YouTube Growth
YouTube Analytics can feel overwhelming at first, and it’s easy to fall into habits that slow growth instead of driving it forward. Many creators get stuck looking at the wrong numbers, some other video mistakes, or misreading what the data is telling them. Here are a few common pitfalls to avoid.
- Only tracking views instead of retention: Views alone don’t reveal whether people are sticking around. Retention and watch time tell a deeper story about your content’s impact.
- Ignoring traffic source insights: If you don’t know where your viewers are coming from, you can’t lean into the platforms or strategies that work best.
- Over-optimizing thumbnails without fixing content: A flashy thumbnail might get clicks, but it won’t save a video that doesn’t deliver on its promise.
- Uploading blindly without reviewing performance: Without checking what’s working (and what’s not), you risk repeating the same mistakes over and over.
Here’s a quick cheat sheet to flip these mistakes into better habits.
| Mistake | Best Practice |
|---|---|
| Focusing only on views | Track retention + watch time |
| Ignoring traffic sources | Double down on top-performing sources |
| Not testing thumbnails | Use the “Test & Compare” feature |
| No upload schedule | Align with “when viewers are online” |
Expert Strategies for Turning YouTube Analytics Into a Competitive Advantage
YouTube Analytics is packed with insights, but the real value comes from how you use them. It’s not about checking numbers every hour; it’s about spotting patterns and turning them into smarter content decisions. To make smarter decisions, it also helps to understand the key marketing metrics worth tracking alongside your YouTube data. Here are a few tips to help you make the most of your data.
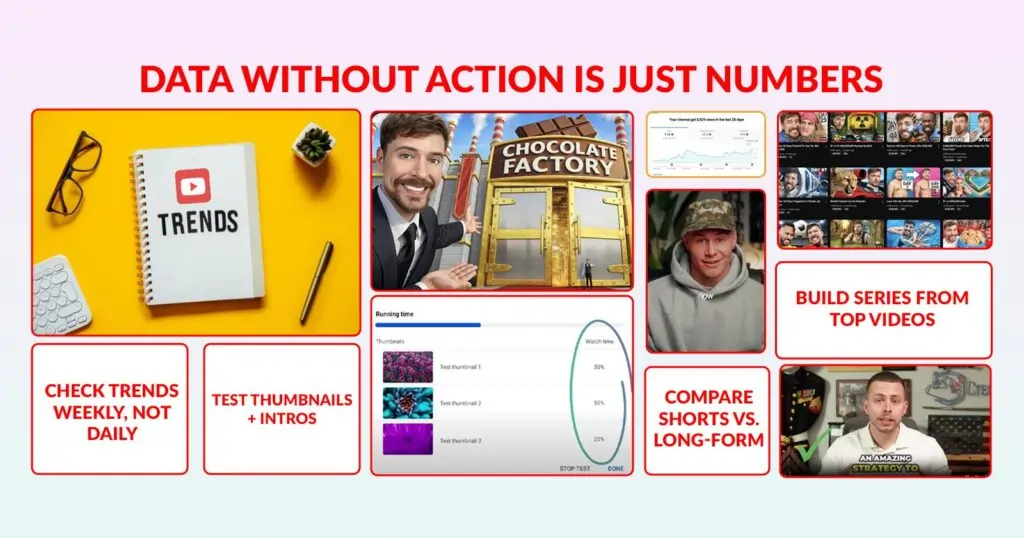
→ Check your numbers weekly, not daily
Daily shifts can feel random, but weekly trends give you a clearer picture of what’s really working.
→ Pay attention to drop-offs and spikes
If people leave within the first 30 seconds, your intro may need tightening. If there’s a spike, note what grabbed attention and repeat it in future videos.
→ Compare formats like Shorts and long-form
Some audiences love quick clips, while others prefer deep dives. Use analytics to see which format earns better watch time.
→ Test thumbnails and intros
A small change in your thumbnail or the way you open a video can have a huge impact on click-through rate and retention.
→ Build a series from your strongest content
When a video takes off, think about creating a follow-up or even a playlist around that theme to keep viewers engaged.
How ShortVids Turns Your Analytics Insights Into Content That Actually Performs
Reading your analytics correctly is half the equation. Executing on those insights with consistently high-quality content is where most channels fall short and where ShortVids becomes the competitive advantage that closes the gap.
When your retention data reveals that viewers drop off because of pacing issues, ShortVids editors fix the pacing. When your CTR data shows thumbnails aren’t converting, our creative team tests new approaches.
When your traffic source data reveals that Shorts are your strongest discovery channel, ShortVids scales your short-form production to match that insight without adding to your production workload.
The Colin Matthew Case Study: Analytics-Driven Production at Scale
Colin Matthew came to ShortVids with strong content ideas but a production bottleneck preventing him from executing at the volume and consistency his analytics were telling him was necessary for growth.
ShortVids took over his entire short-form video production workflow across Facebook, Instagram, and YouTube, delivering platform-optimized content consistently against his content calendar every single week.
The result? 4M+ Shorts views across three platforms in six months, driven by consistent production that turned analytics insights into content that performed exactly where his audience data said it would.
That’s what happens when the right data meets the right execution partner.
Final Thoughts
YouTube Analytics tells you everything you need to know to grow your channel. Most creators read the numbers but never act on them fast enough or consistently enough to compound the results. The brands winning on YouTube in 2026 aren’t just better at analytics, they’re better at execution. They turn insights into content faster, more consistently, and at a higher quality standard than their competitors. ShortVids bridges that gap, turning your analytics data into a production strategy that keeps your channel growing week after week. Call ShortVids Now & Let’s Turn Your Analytics into a Growth Engine!
Frequently Asked Questions
Watch time, average view duration, CTR, and audience retention are the four metrics that most directly influence algorithmic reach and subscriber conversion, which are the primary drivers of commercial channel growth. Revenue metrics like RPM and CPM then tell you which content types are generating the strongest financial return per view. ShortVids helps clients optimize for all of these metrics simultaneously through data-driven content production.
YouTube Studio data is the official performance source and is highly reliable, though numbers can take 24–48 hours to fully update after upload. For brands making significant content investments, pairing YouTube Studio data with third-party tools like VidIQ and TubeBuddy adds additional strategic context that makes decisions more confident and commercially sound.
High views with low watch time almost always indicate a mismatch between what your thumbnail or title promises and what your content delivers. Viewers click, feel misled, and leave within seconds, which damages your algorithmic standing more than low views would. ShortVids helps clients fix this through tighter editing, stronger video openings, and content structures that deliver on the promise that earned the click.
The Audience tab in YouTube Studio identifies exactly which videos are converting viewers into subscribers and those videos are your strategic blueprint. Build series, playlists, and follow-up content around those formats and topics to compound the subscriber growth they generate.
Thumbnail testing is the highest-leverage CTR improvement available without touching your content itself. YouTube’s Test and Compare feature lets you run thumbnail variations against each other and identify which creative approach earns more clicks from the same impression pool. ShortVids includes thumbnail creation and testing support as part of our production service, so clients never leave CTR improvements on the table.
ShortVids treats every client’s analytics data as a production brief. Retention drop-off points inform editing decisions. Traffic source data shapes format prioritization. Audience demographic data influences content tone and posting timing. The result is a production workflow where every creative decision is backed by real performance data, not assumptions.
Book a Call Today
- Fixed monthly plans starting at $999
- 24-hour turnaround time (or less) on all short-form edits
- 3-layer quality check system on every video
- No more chasing freelancers or managing editors
- Scale up to 50+ videos/month without hiring in-house
- Content team trained on platform trends, scroll-stopping hooks & storytelling
- Fully managed by professionals – you just upload & approve
- Response time: Under 1 hour (US & GCC time zones)
Cut your production costs, not your standards.